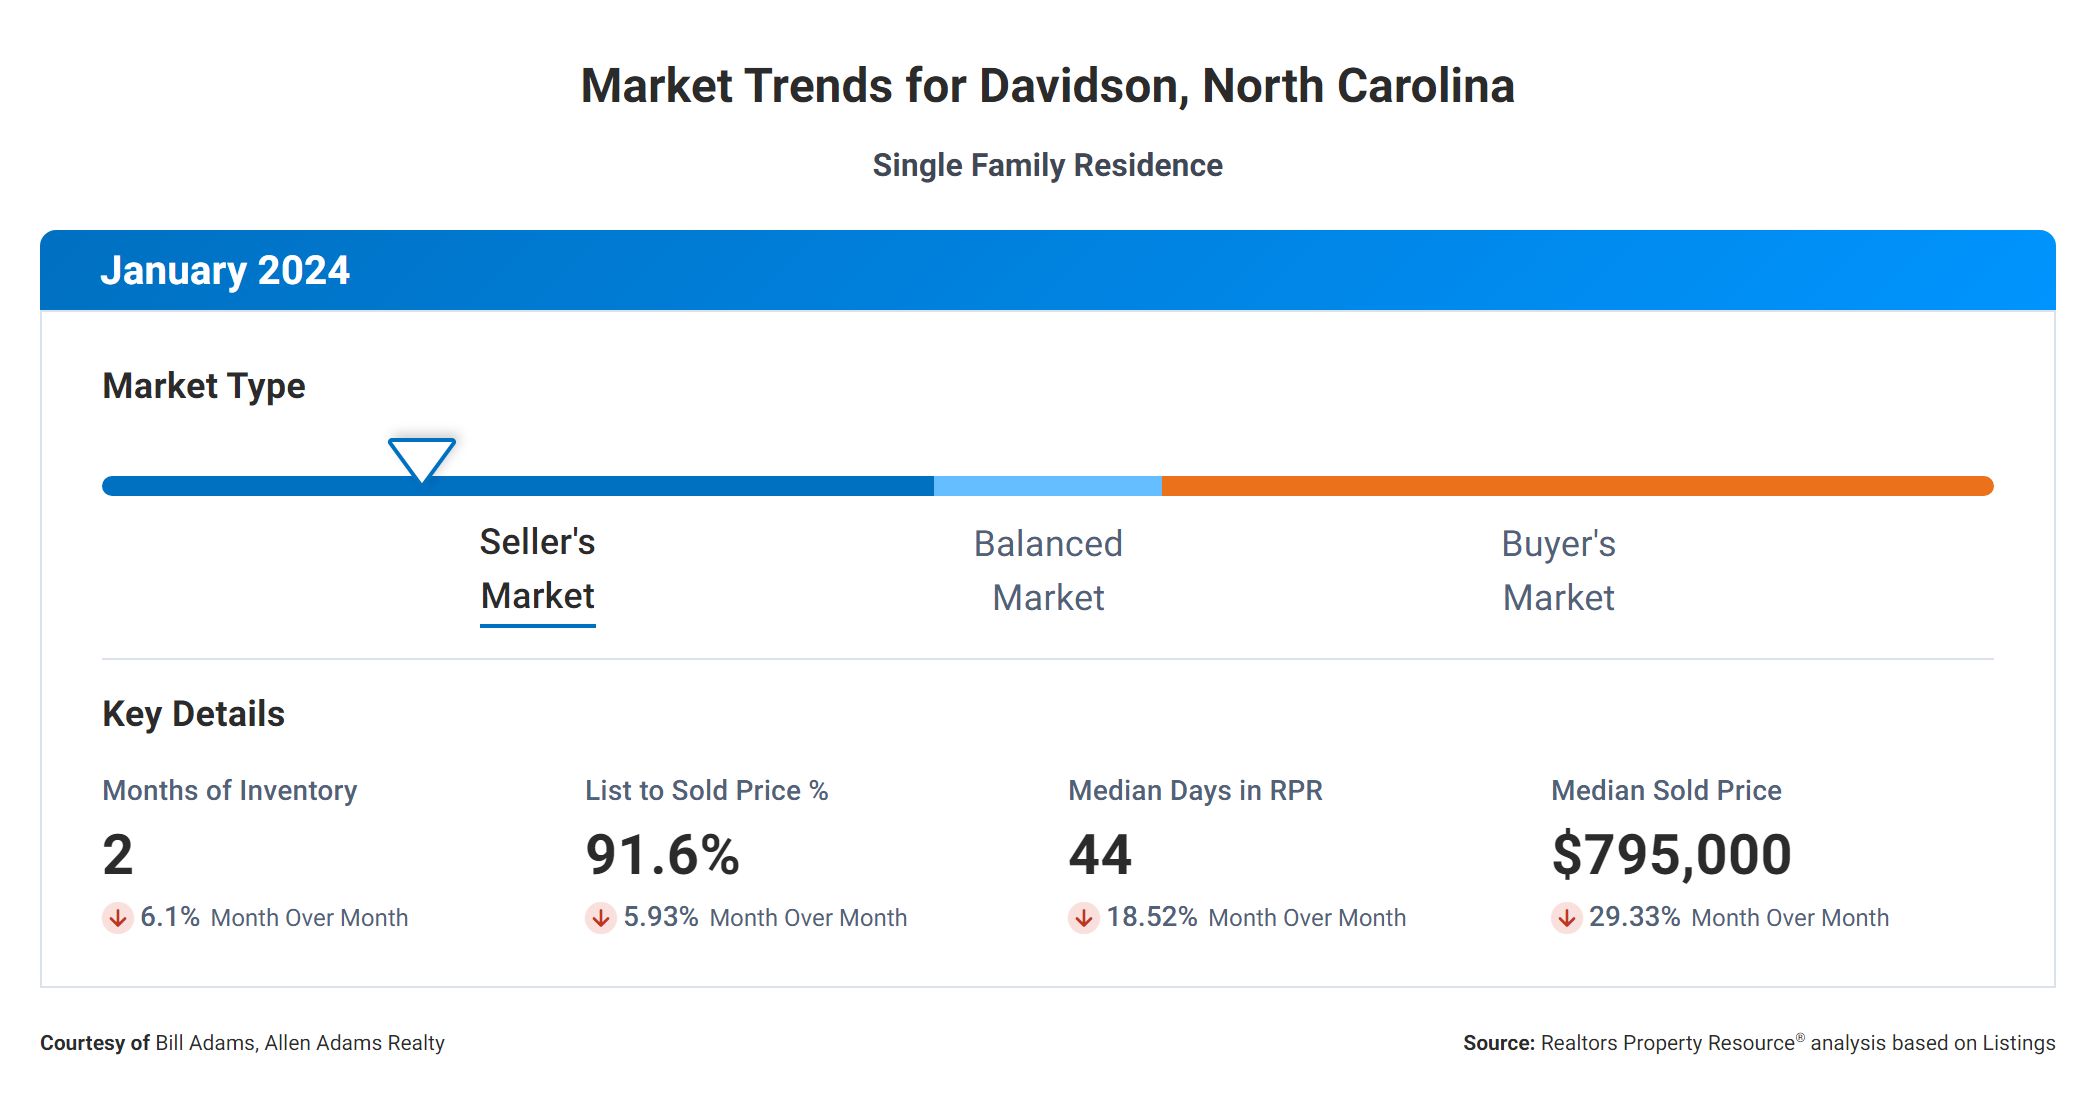
Davidson, NC Real Estate Trends For January 2024
In the world of real estate, there are several key metrics that both buyers and sellers should pay close attention to. These metrics provide valuable insights into the current state of the market and can help inform important decisions. Today, we will explore the correlation between months supply of inventory, 12-month change in months of inventory, median days homes are on the market, list to sold price percentage, and median sold price. By understanding how these metrics relate to each other, you will be better equipped to navigate the real estate landscape.
Months Supply
Let’s start with the months supply of inventory, which currently stands at 2. This metric represents the number of months it would take to sell all existing inventory if no new listings were added. A lower number indicates a seller’s market, where demand exceeds supply. In this scenario, sellers have the advantage as competition among buyers is fierce, potentially driving up prices.
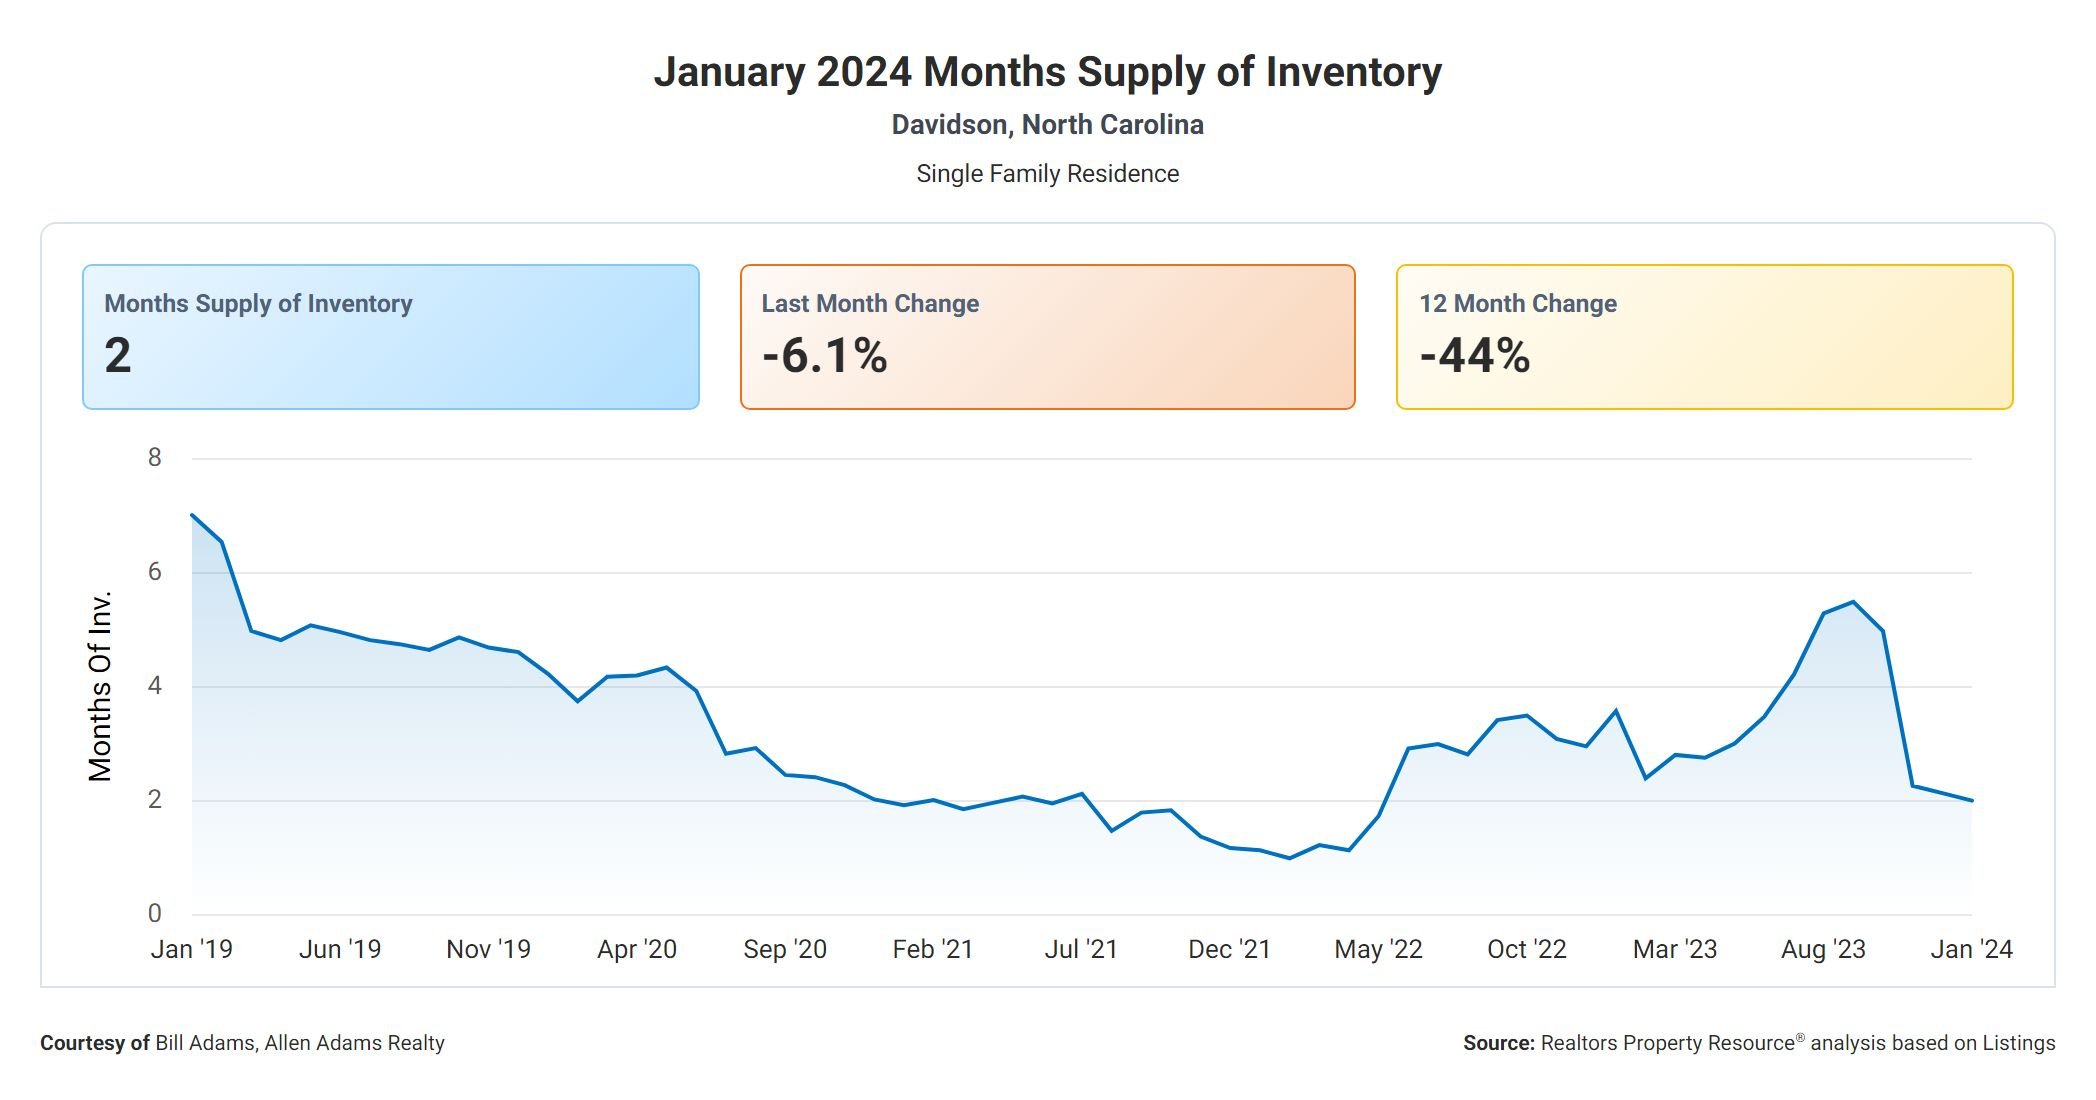
The 12-month change in months of inventory is an important indicator of market trends. With a decrease of -43.98%, it suggests a significant reduction in the availability of homes for sale compared to the previous year. This decline indicates a tightening market, where inventory is decreasing at a faster pace. Buyers may face challenges finding suitable properties, while sellers can expect increased demand and potentially higher prices.
Days On Market
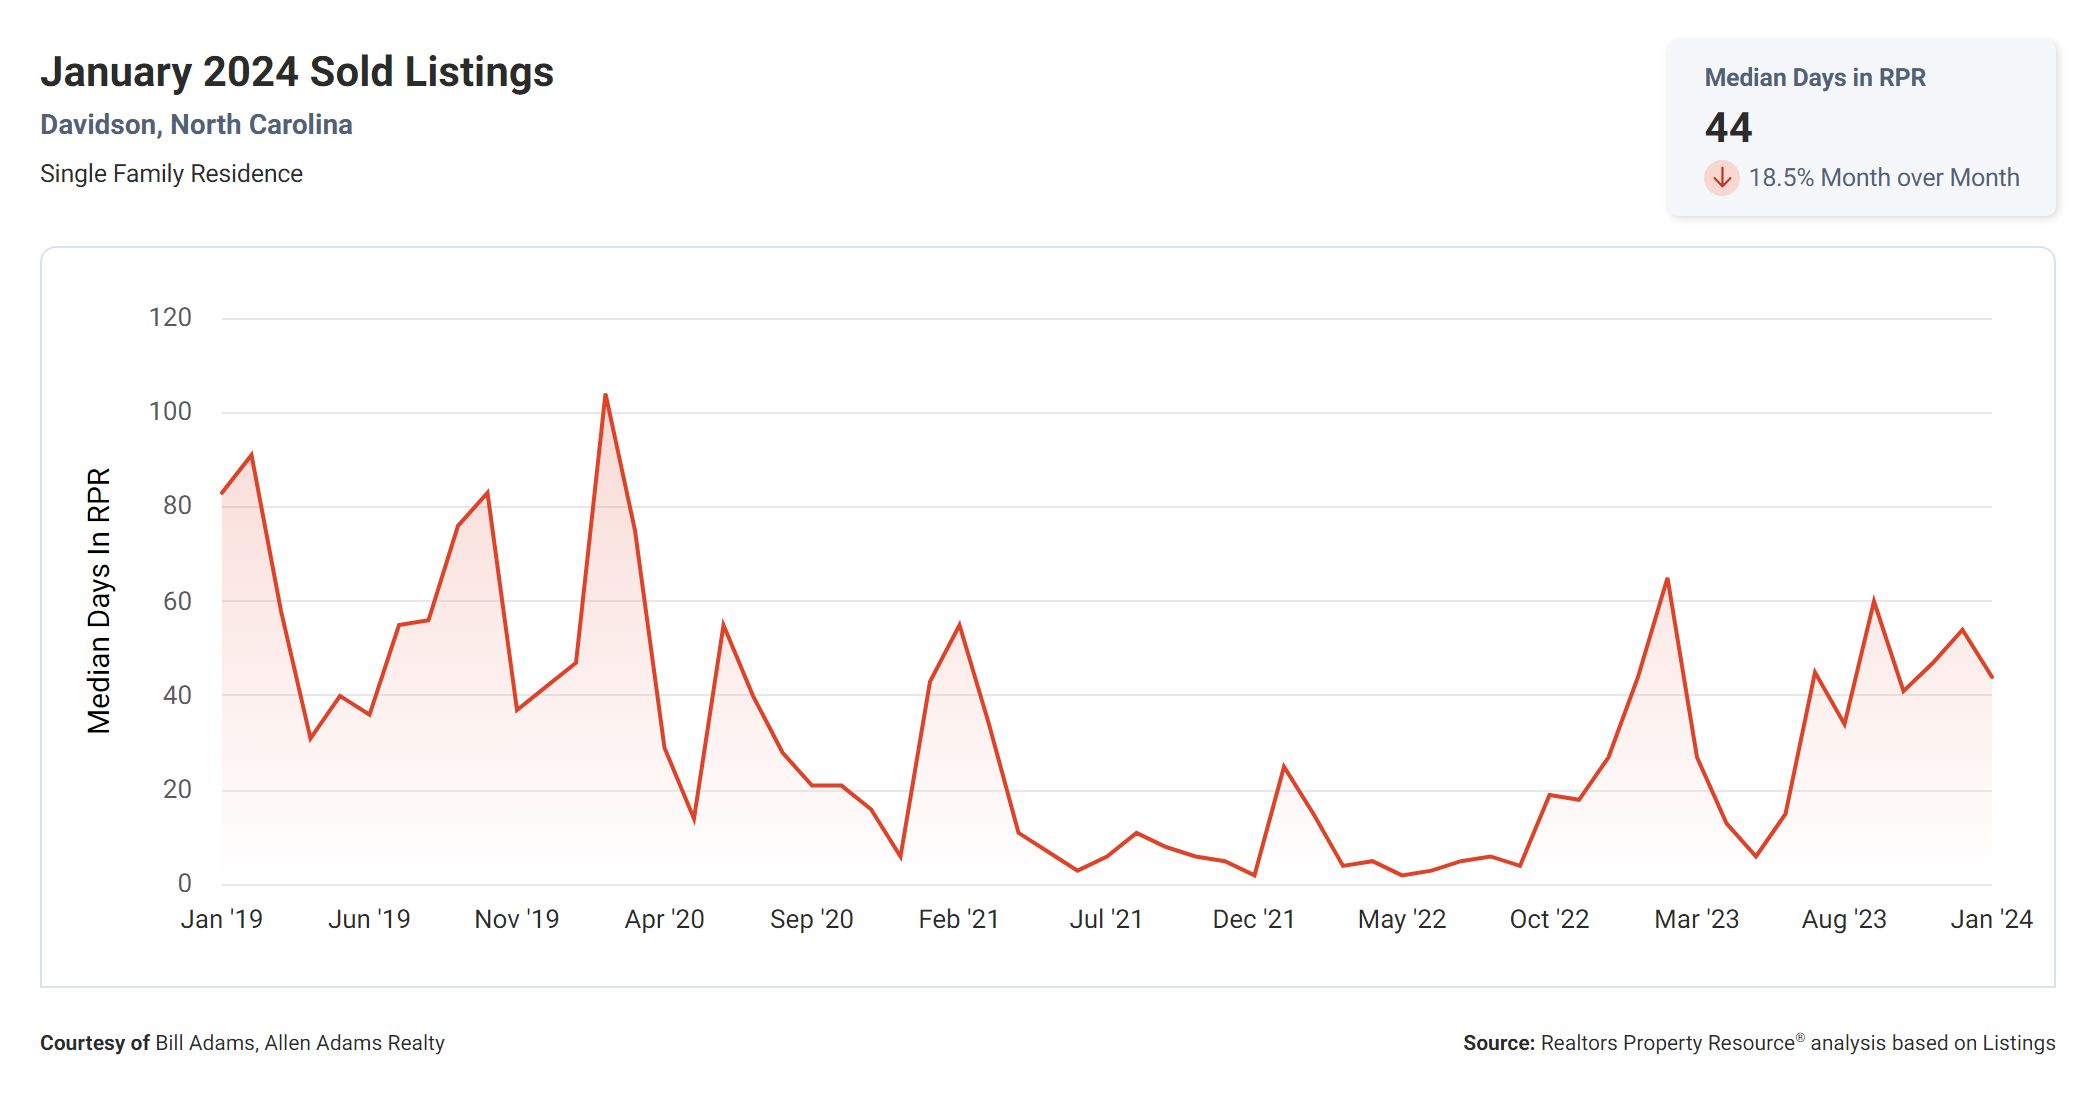
Median days homes are on the market is another metric that provides valuable insight into market dynamics. At 44 days, it indicates that properties are spending a relatively short amount of time on the market before being sold. This suggests a fast-paced market, where properties are in high demand and buyers need to act swiftly to secure their desired homes. Sellers can expect a quicker turnaround time, but buyers may face increased competition.
Sale Price Versus List Price
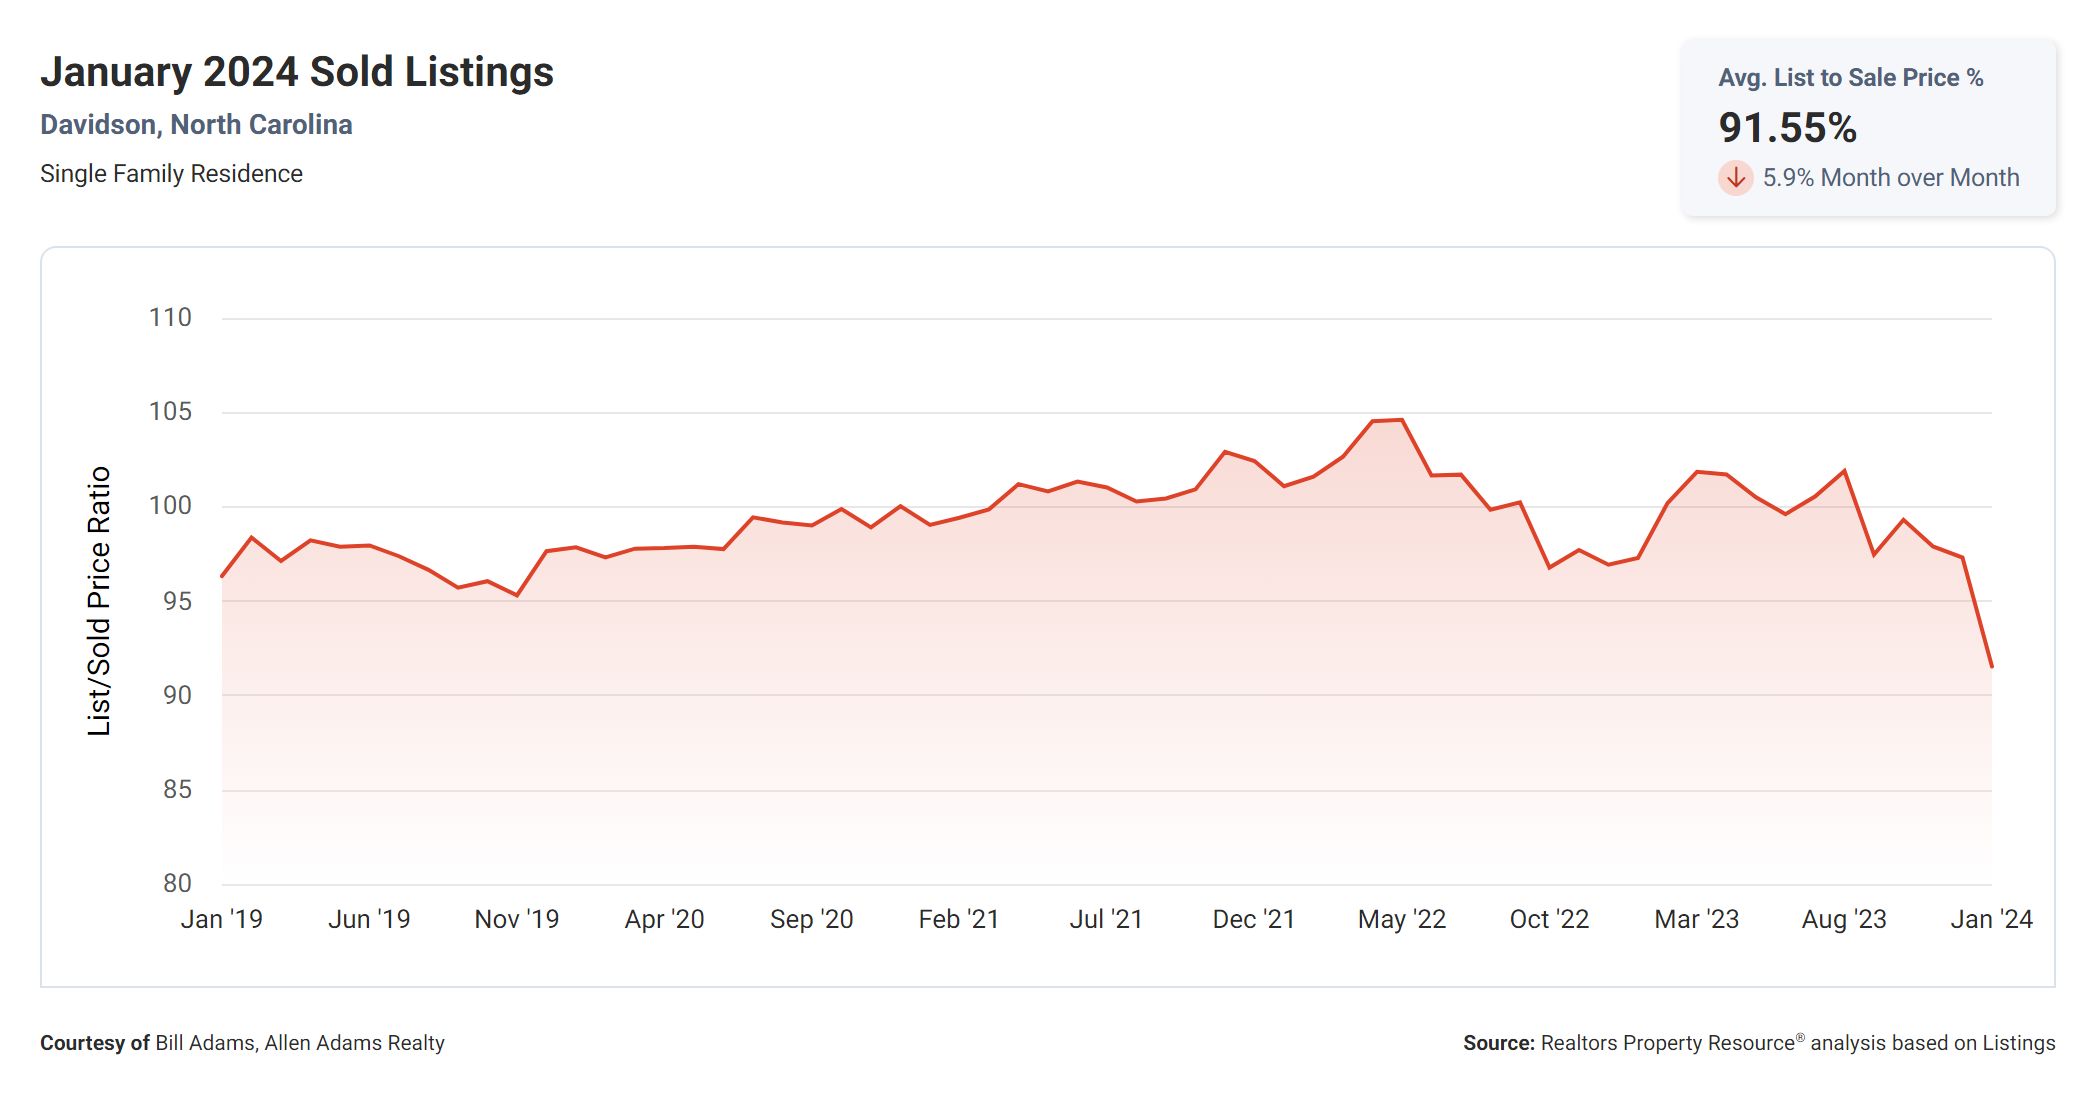
The list to sold price percentage is a crucial metric for both buyers and sellers. With a percentage of 91.6%, it indicates that, on average, homes are selling for approximately 91.6% of their listing price. This suggests that sellers have some negotiating power, as buyers are submitting offers below the initial asking price. However, it is important to note that this is just an average, and individual negotiations can vary significantly.
Median Sold Price
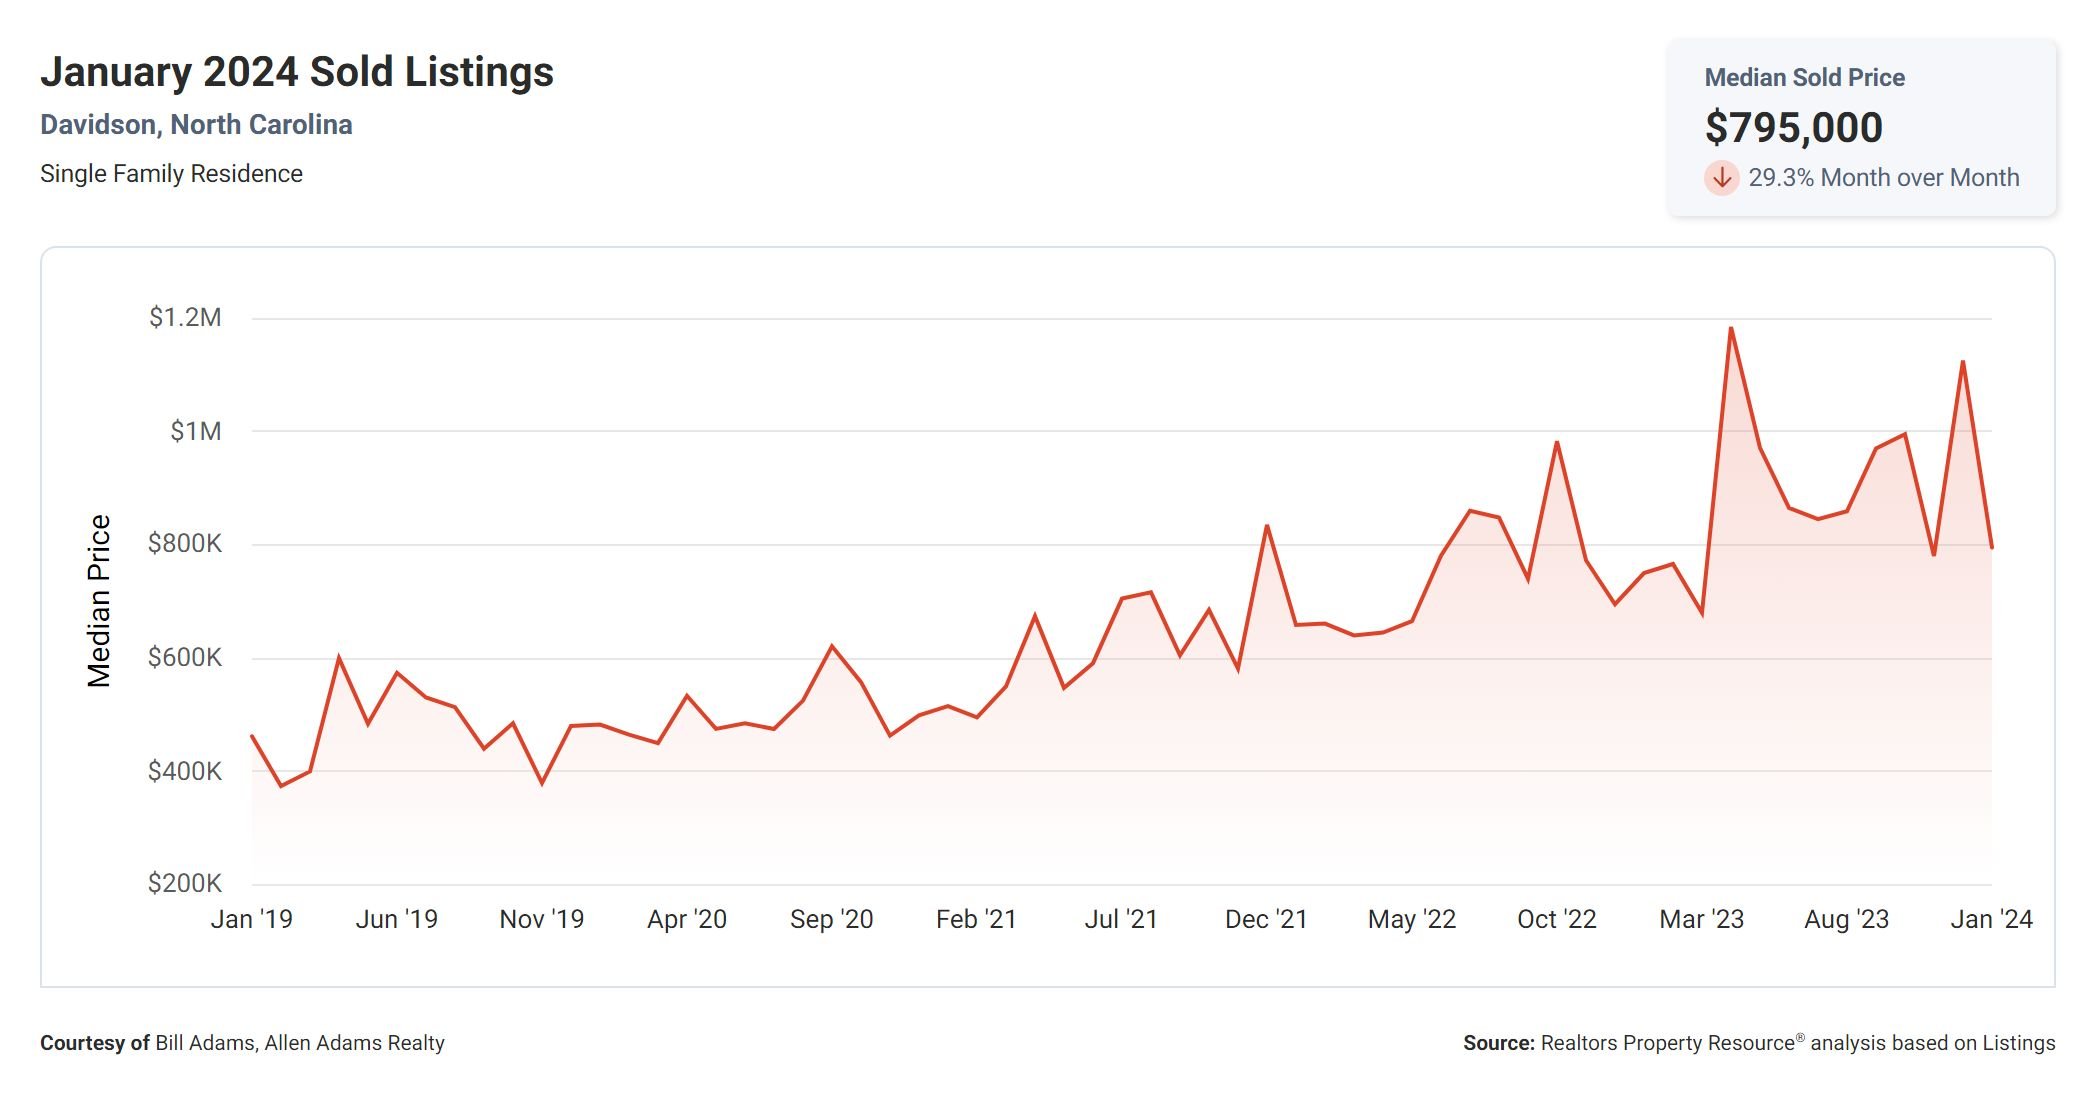
Lastly, the median sold price stands at $795,000. This metric represents the middle value of all sold prices, indicating the price at which half of the properties sold for more and half sold for less. It provides a snapshot of the overall market and can help both buyers and sellers understand the price range they can expect.
What The Numbers Mean
When we examine the correlation between these metrics, we can see how they are interconnected. The low months supply of inventory and the significant decline in the 12-month change in months of inventory suggest a tightening market with limited availability. This, in turn, contributes to the relatively short median days homes are on the market, indicating high demand. The list to sold price percentage reflects the negotiation power of sellers, potentially resulting from the limited inventory. Lastly, the median sold price gives us an idea of the price range within this market.
Conclusion
In conclusion, these real estate metrics provide valuable insights into the current market conditions. For buyers, it is important to be prepared for a competitive market with limited options and potential negotiations on price. Sellers, on the other hand, can expect increased demand and potentially higher prices. By keeping a close eye on these metrics and understanding their correlation, both buyers and sellers can make informed decisions and navigate the real estate landscape with confidence.
Ready To Make Davidson, NC Your Home?
View Davidson, NC Homes For Sale

