The real estate market is constantly evolving, and as buyers and sellers, it’s important to understand the various metrics that can help us gauge the health of the market. Today, we will explore the correlation between several key real estate metrics to give you a better understanding of the current Mooresville, NC real estate market conditions.
Months Supply
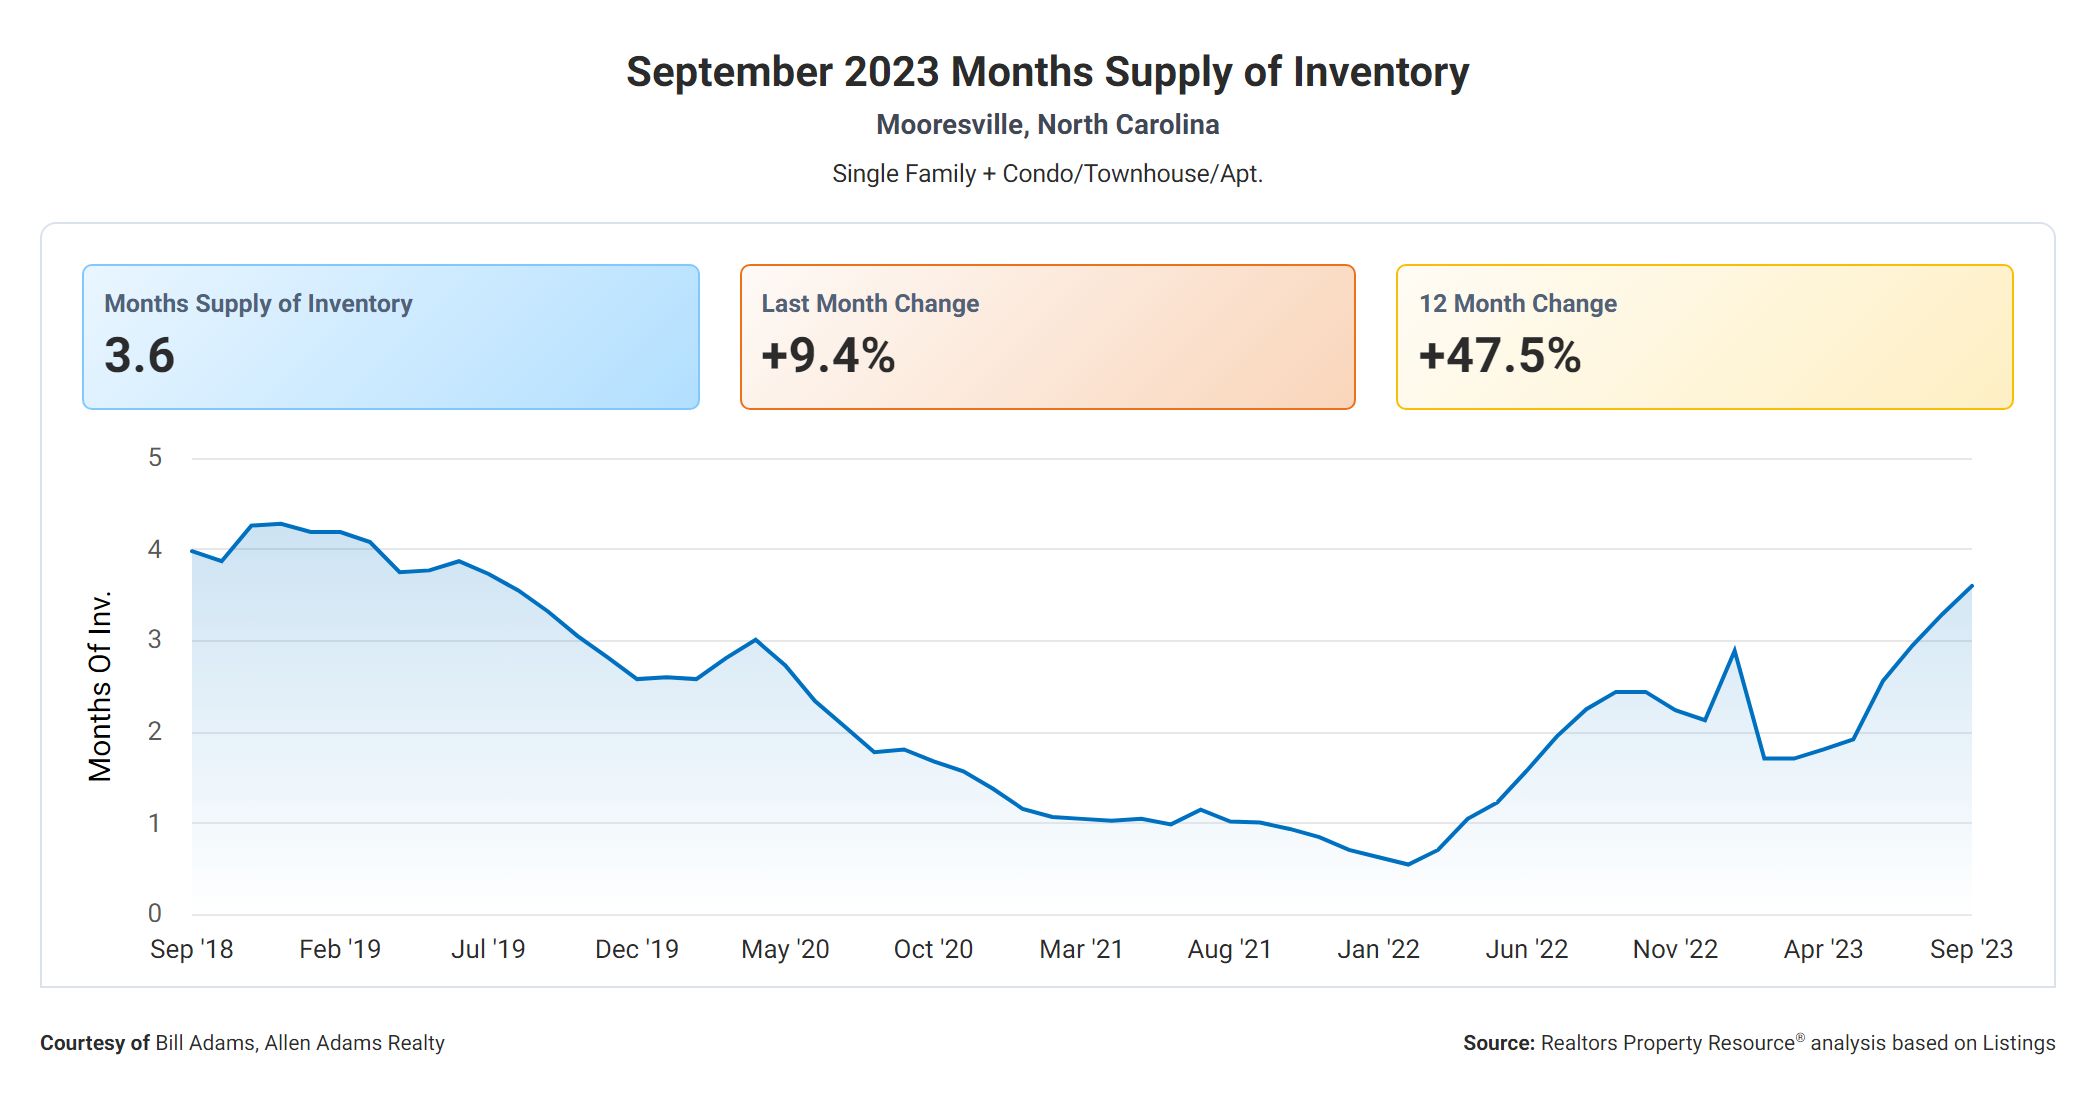
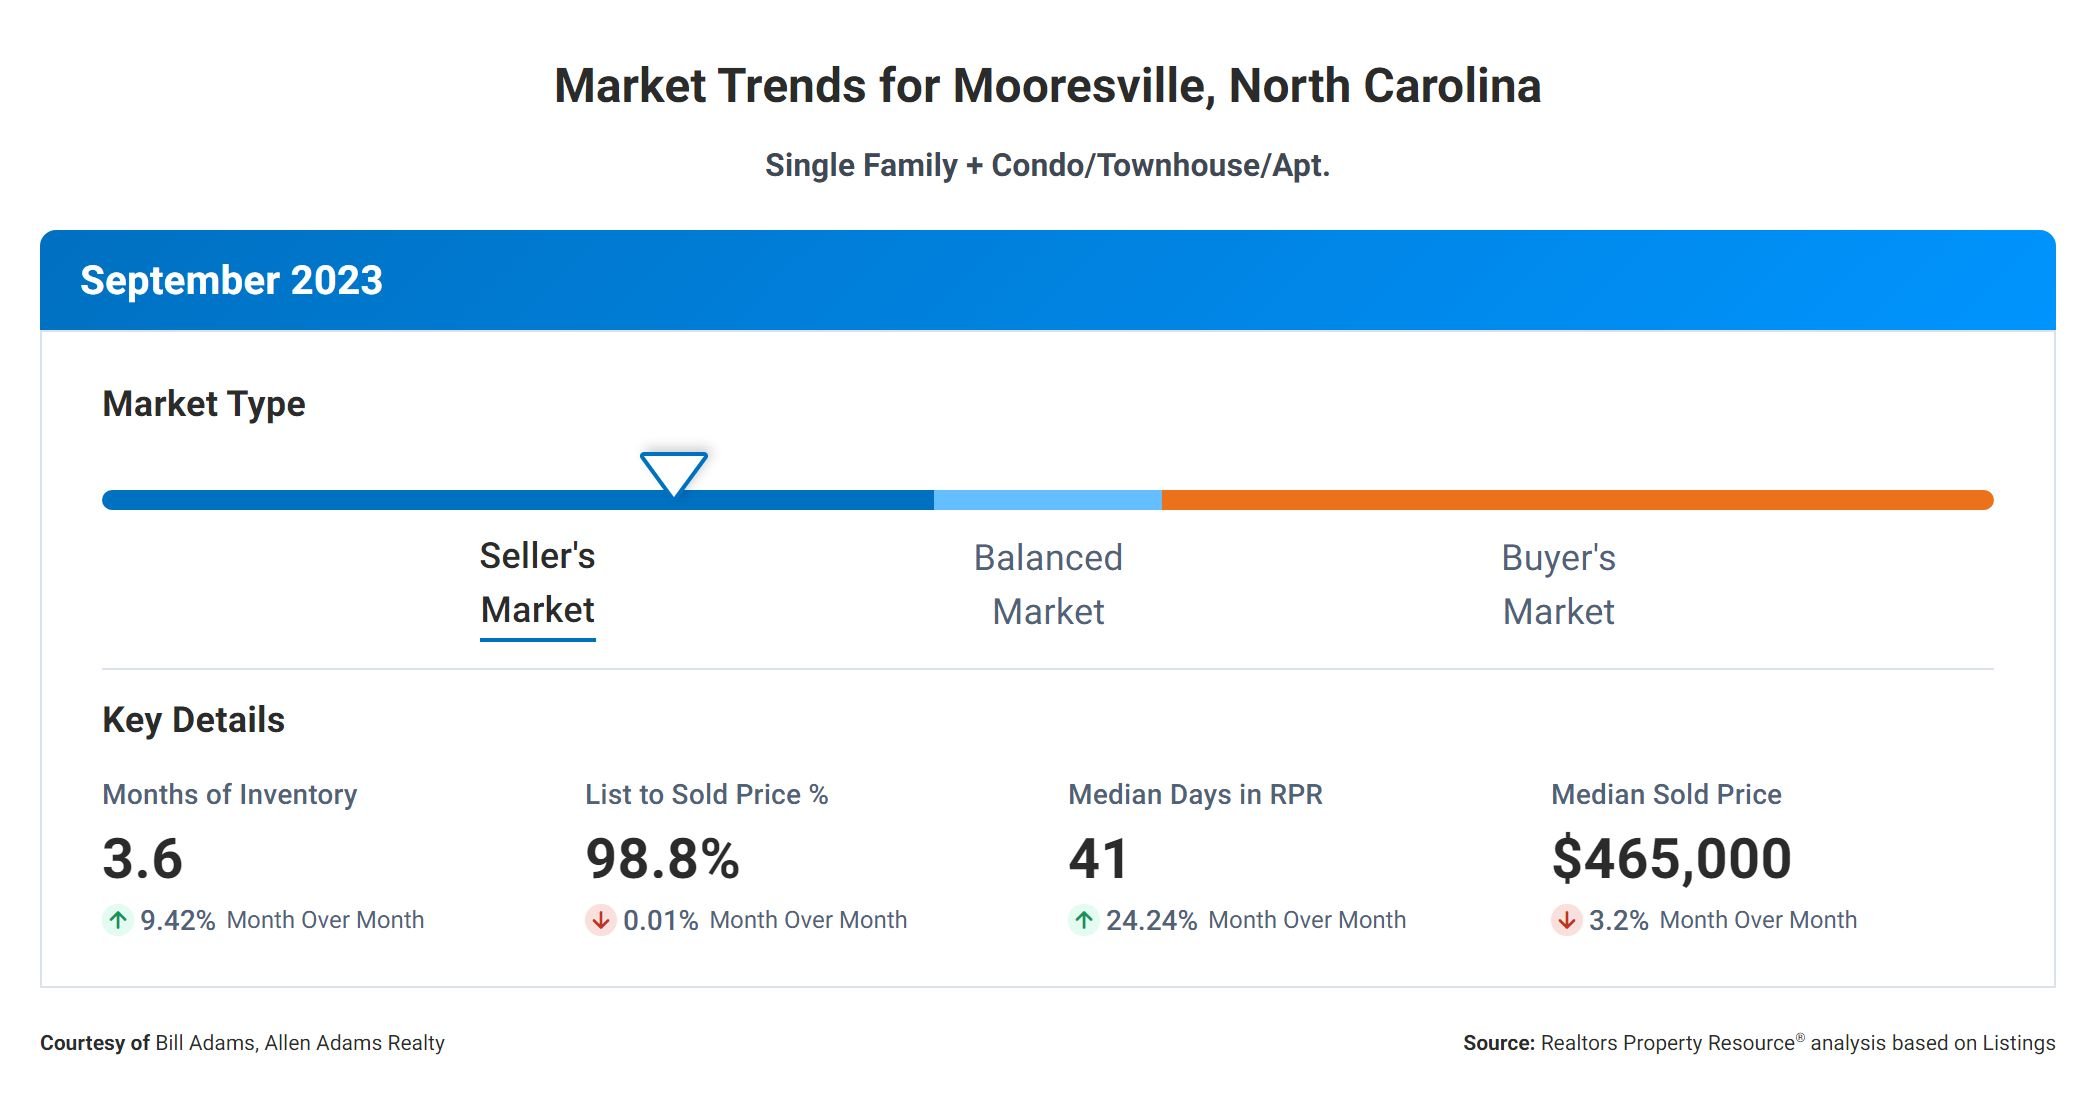
First, let’s talk about the “Months Supply of Inventory.” This metric measures the number of months it would take to sell all the available homes on the market if no new listings were added. In our case, the months supply of inventory stands at 3.6 months. This suggests that, based on the current pace of sales, it would take approximately 3.6 months to sell all the homes available for sale.

Now, let’s look at the “12-Month Change in Months of Inventory,” which shows how the months supply of inventory has changed compared to the previous year. In this case, we have seen a significant increase of +47.54% in the months of inventory over the past year. This indicates that inventory levels have risen, potentially giving buyers more options to choose from.
Days On Market
Moving on, the “Median Days Homes are On the Market” measures the average number of days it takes for a home to sell. Currently, homes are spending approximately 41 days on the market. This suggests that properties are selling relatively quickly, which can be a positive sign for sellers.

Sale Price Versus List Price
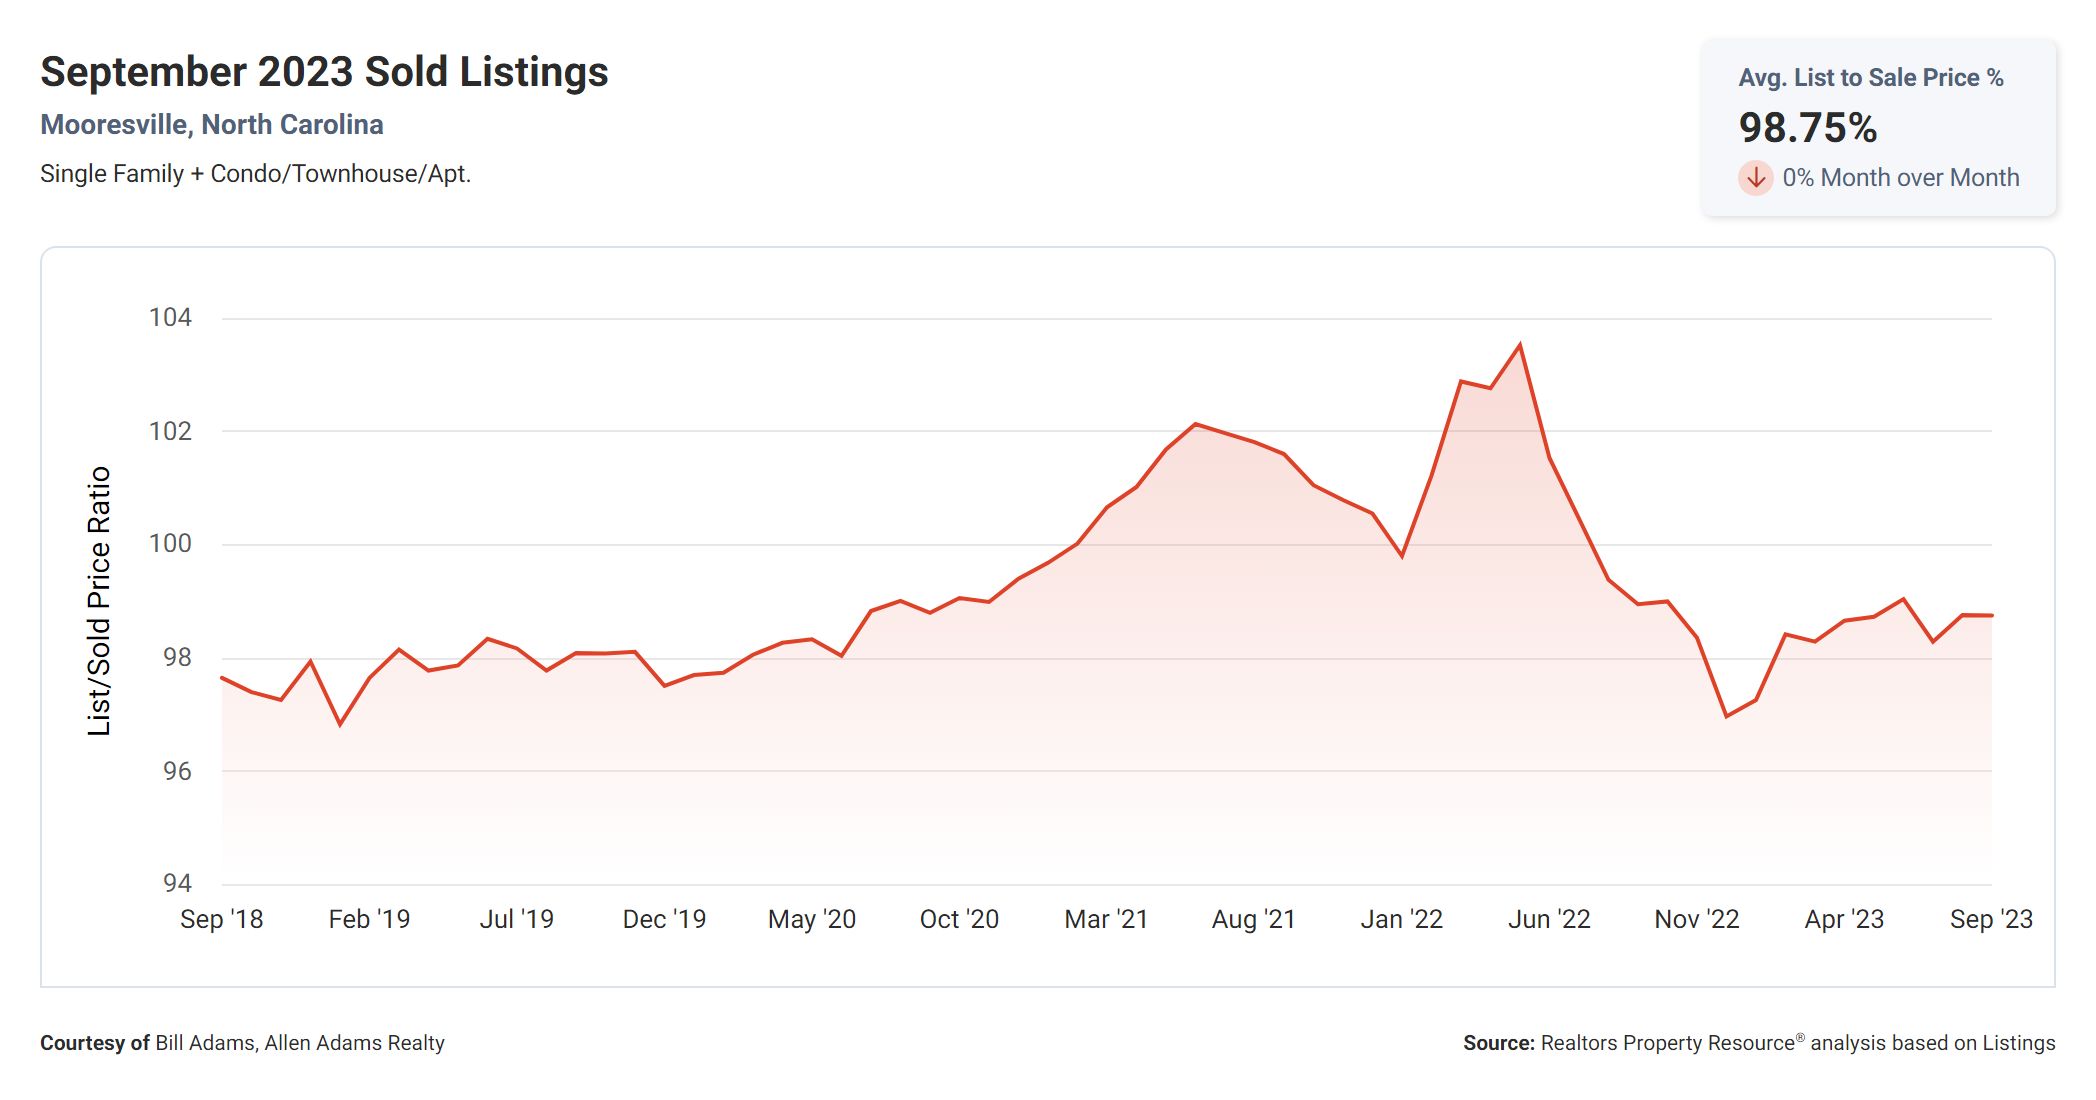
Next, let’s discuss the “List to Sold Price Percentage.” This metric reveals the percentage of the listing price that sellers are able to achieve when selling their homes. In our market, the list to sold price percentage is 98.8%. This indicates that, on average, sellers are able to sell their homes for 98.8% of their initial listing price. This is a positive indicator for sellers, as it shows that they are able to secure a high percentage of their asking price.

Median Sold Price
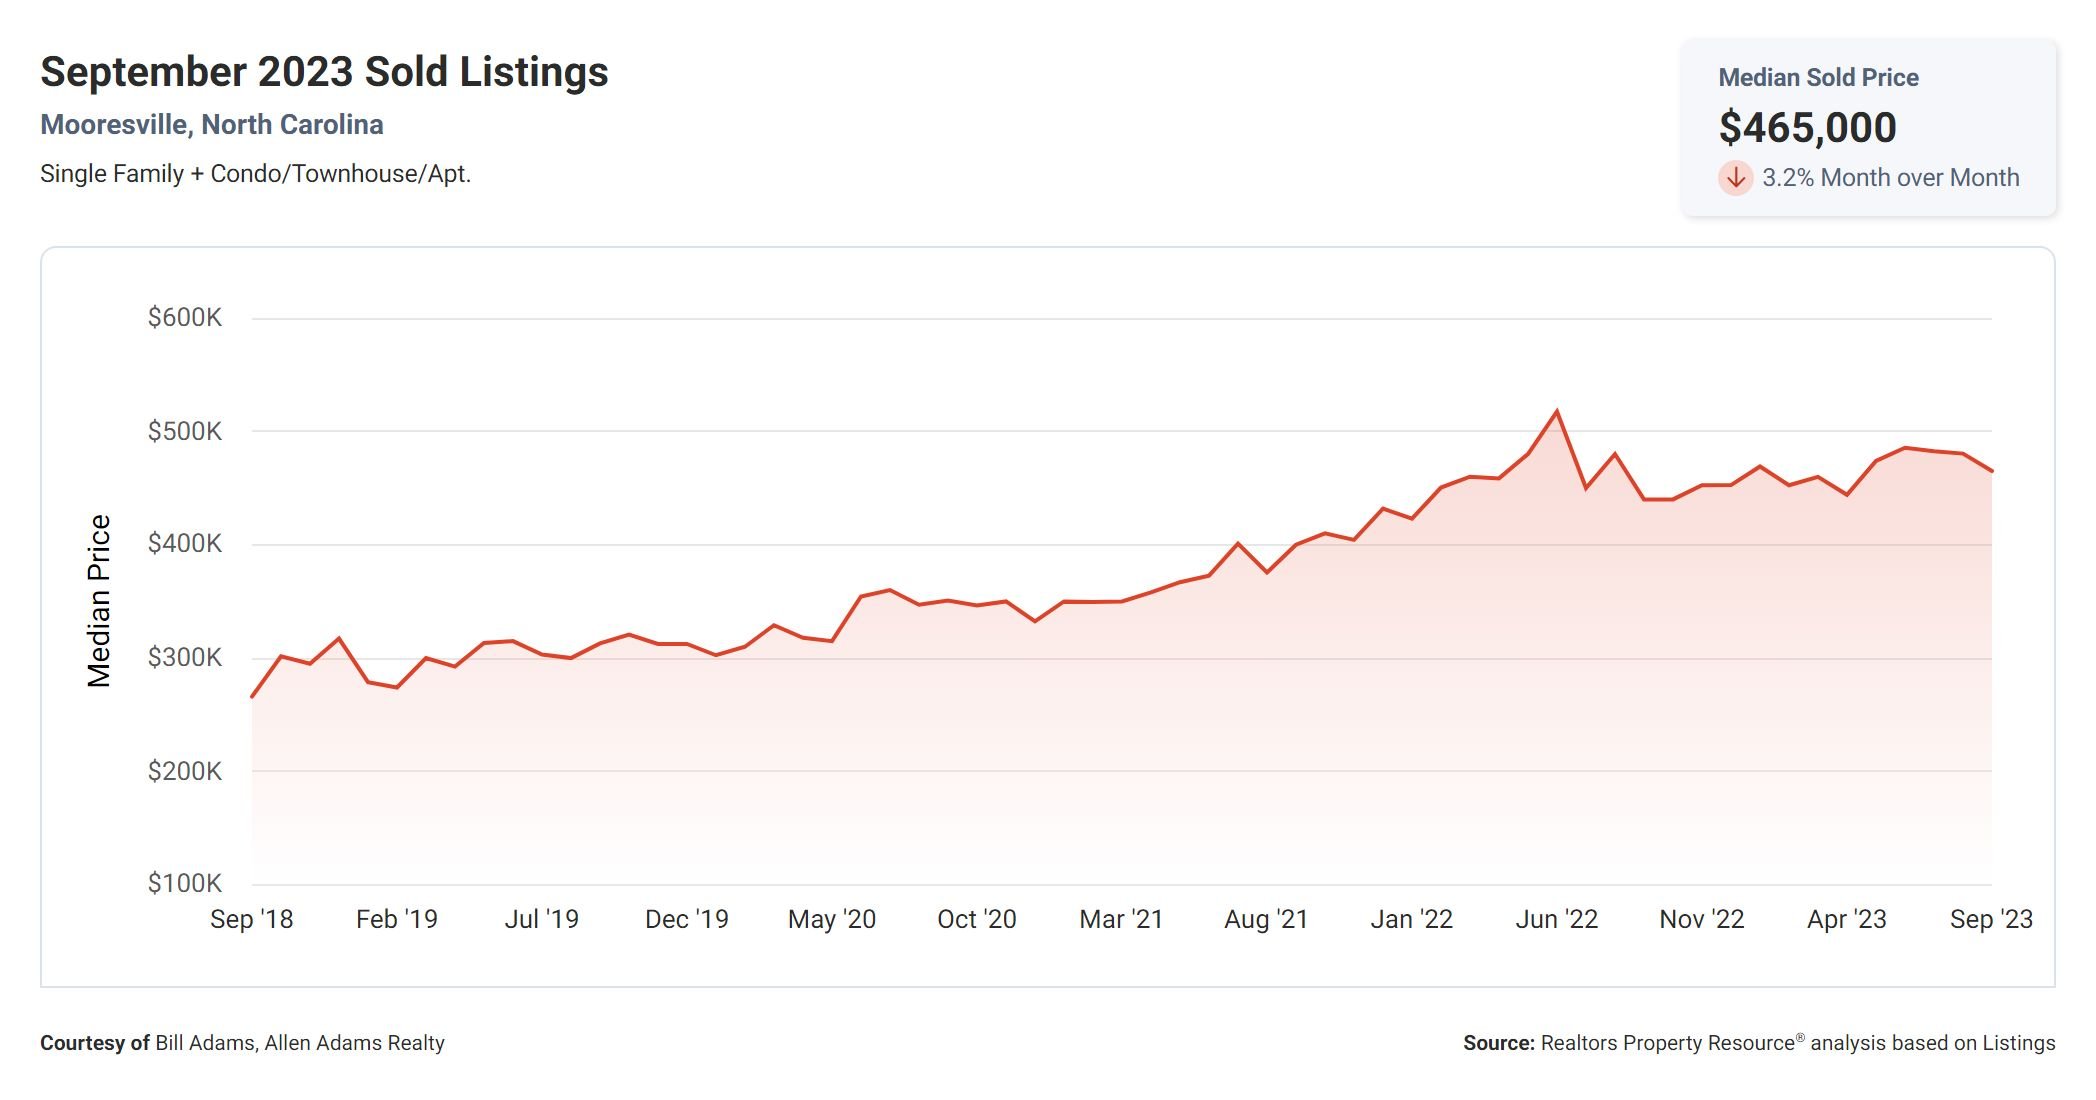
Lastly, we have the “Median Sold Price,” which represents the middle point of all the sold prices in a given time period. In our market, the median sold price is $465,000. This means that half of the sold properties were sold for less than $465,000, while the other half sold for more. It’s important to note that this is an overall median and individual neighborhoods or property types may have different median prices.

What The Numbers Mean
When we look at these metrics together, we can draw a few conclusions. The increase in the months supply of inventory suggests that there is a greater availability of homes on the market, potentially giving buyers more options to choose from. However, the relatively low median days on the market and high list to sold price percentage indicate that homes are still selling quickly and sellers are achieving a high percentage of their asking prices.
For buyers, this information suggests that there may be more inventory to choose from, which could potentially provide more negotiating power. For sellers, it’s important to be mindful of the increasing inventory levels and price competitively to attract buyers.
Conclusion
Overall, these metrics provide valuable insights into the current Mooresville real estate market. It’s important for both buyers and sellers to understand these correlations to make informed decisions. Whether you’re looking to buy or sell, keeping an eye on these metrics can help you navigate the market and achieve your real estate goals.
If you would like to see Mooresville listings of homes for sale or learn more about the area click here.


