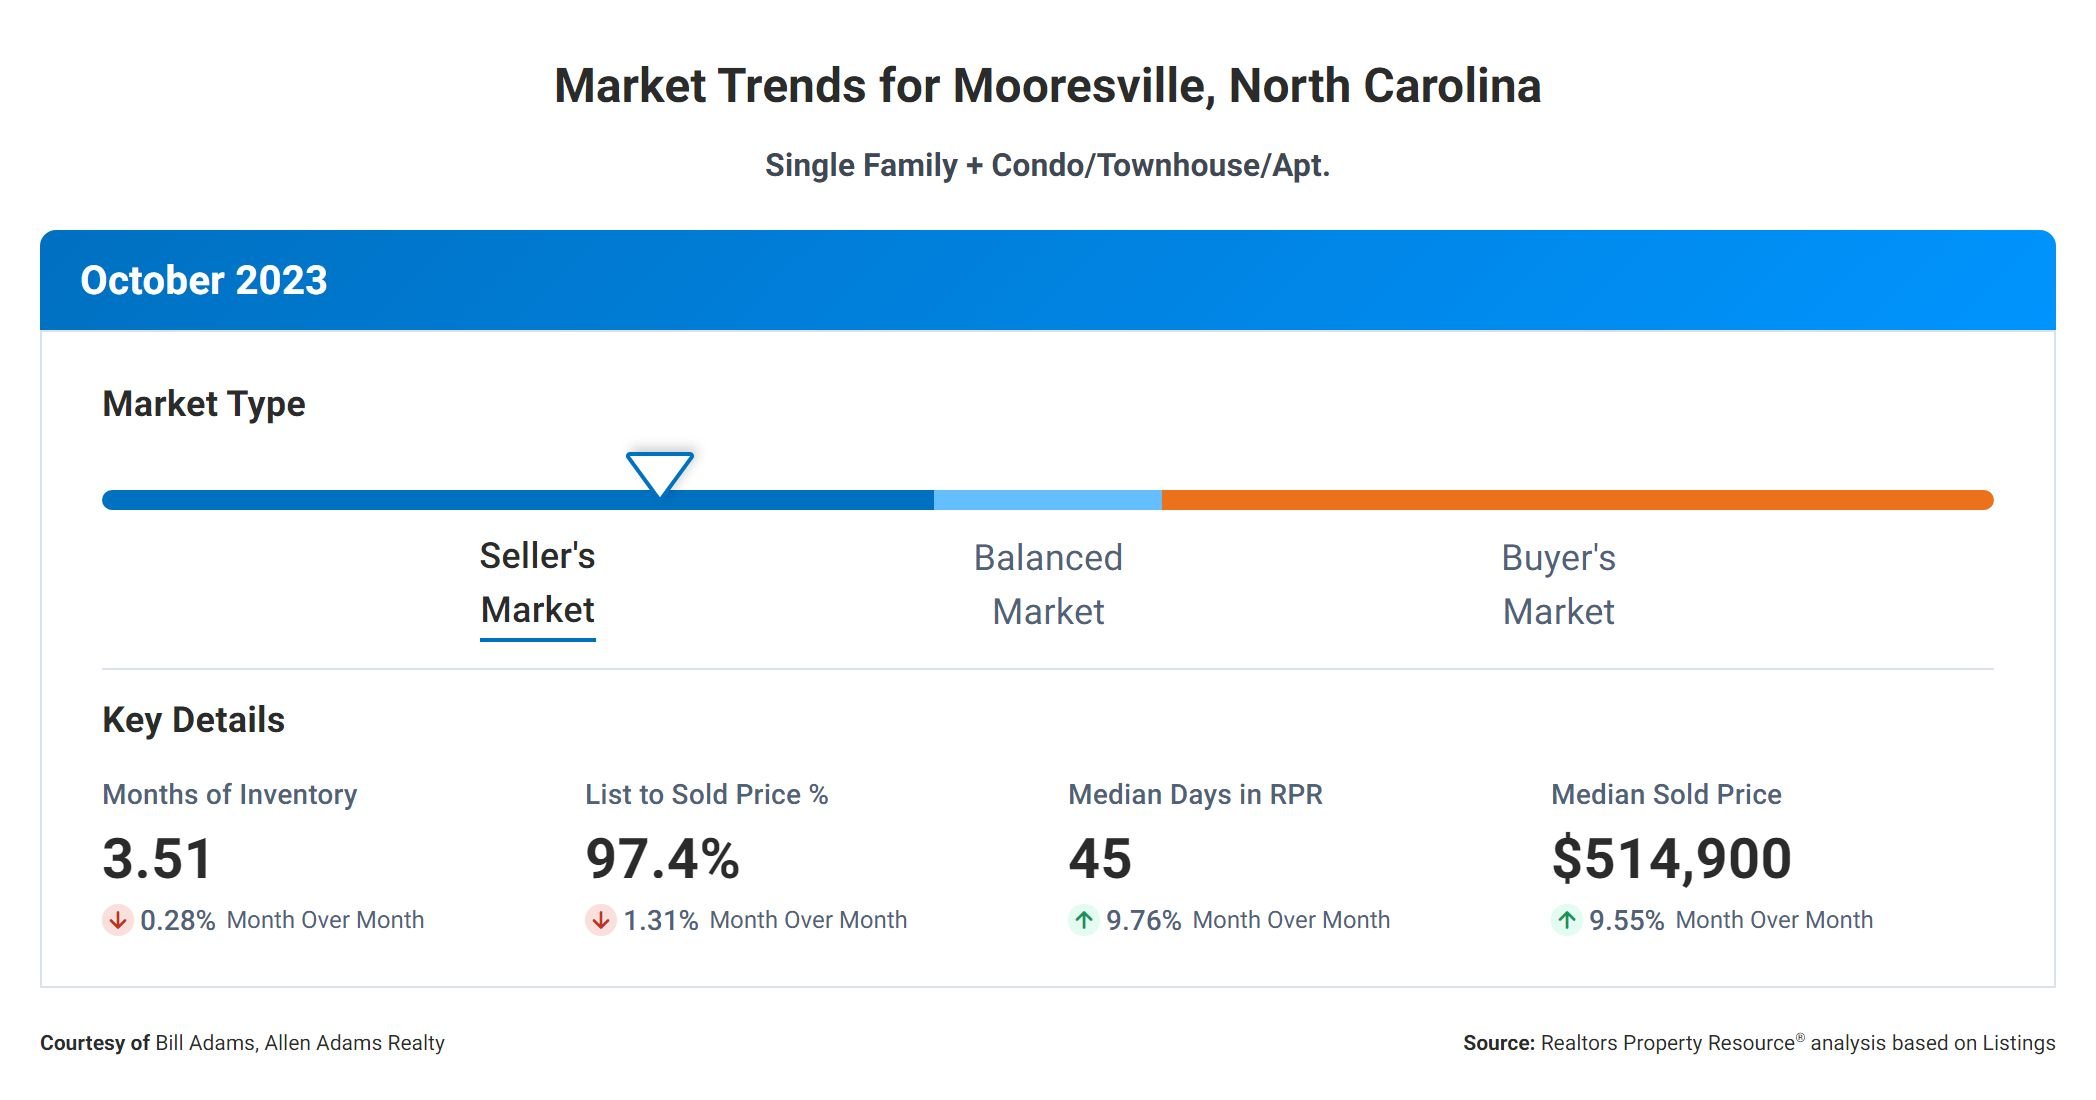
When it comes to the Mooresville, NC real estate market, there are several key metrics that can help both buyers and sellers make informed decisions. Let’s take a closer look at these metrics and the correlations between them.
Months Supply
First, let’s discuss the Months Supply of Inventory, which currently stands at 3.51. This metric measures the number of months it would take to sell all the existing homes on the market if no new listings were added. A lower supply of inventory indicates a seller’s market, as there are fewer homes available for buyers to choose from.
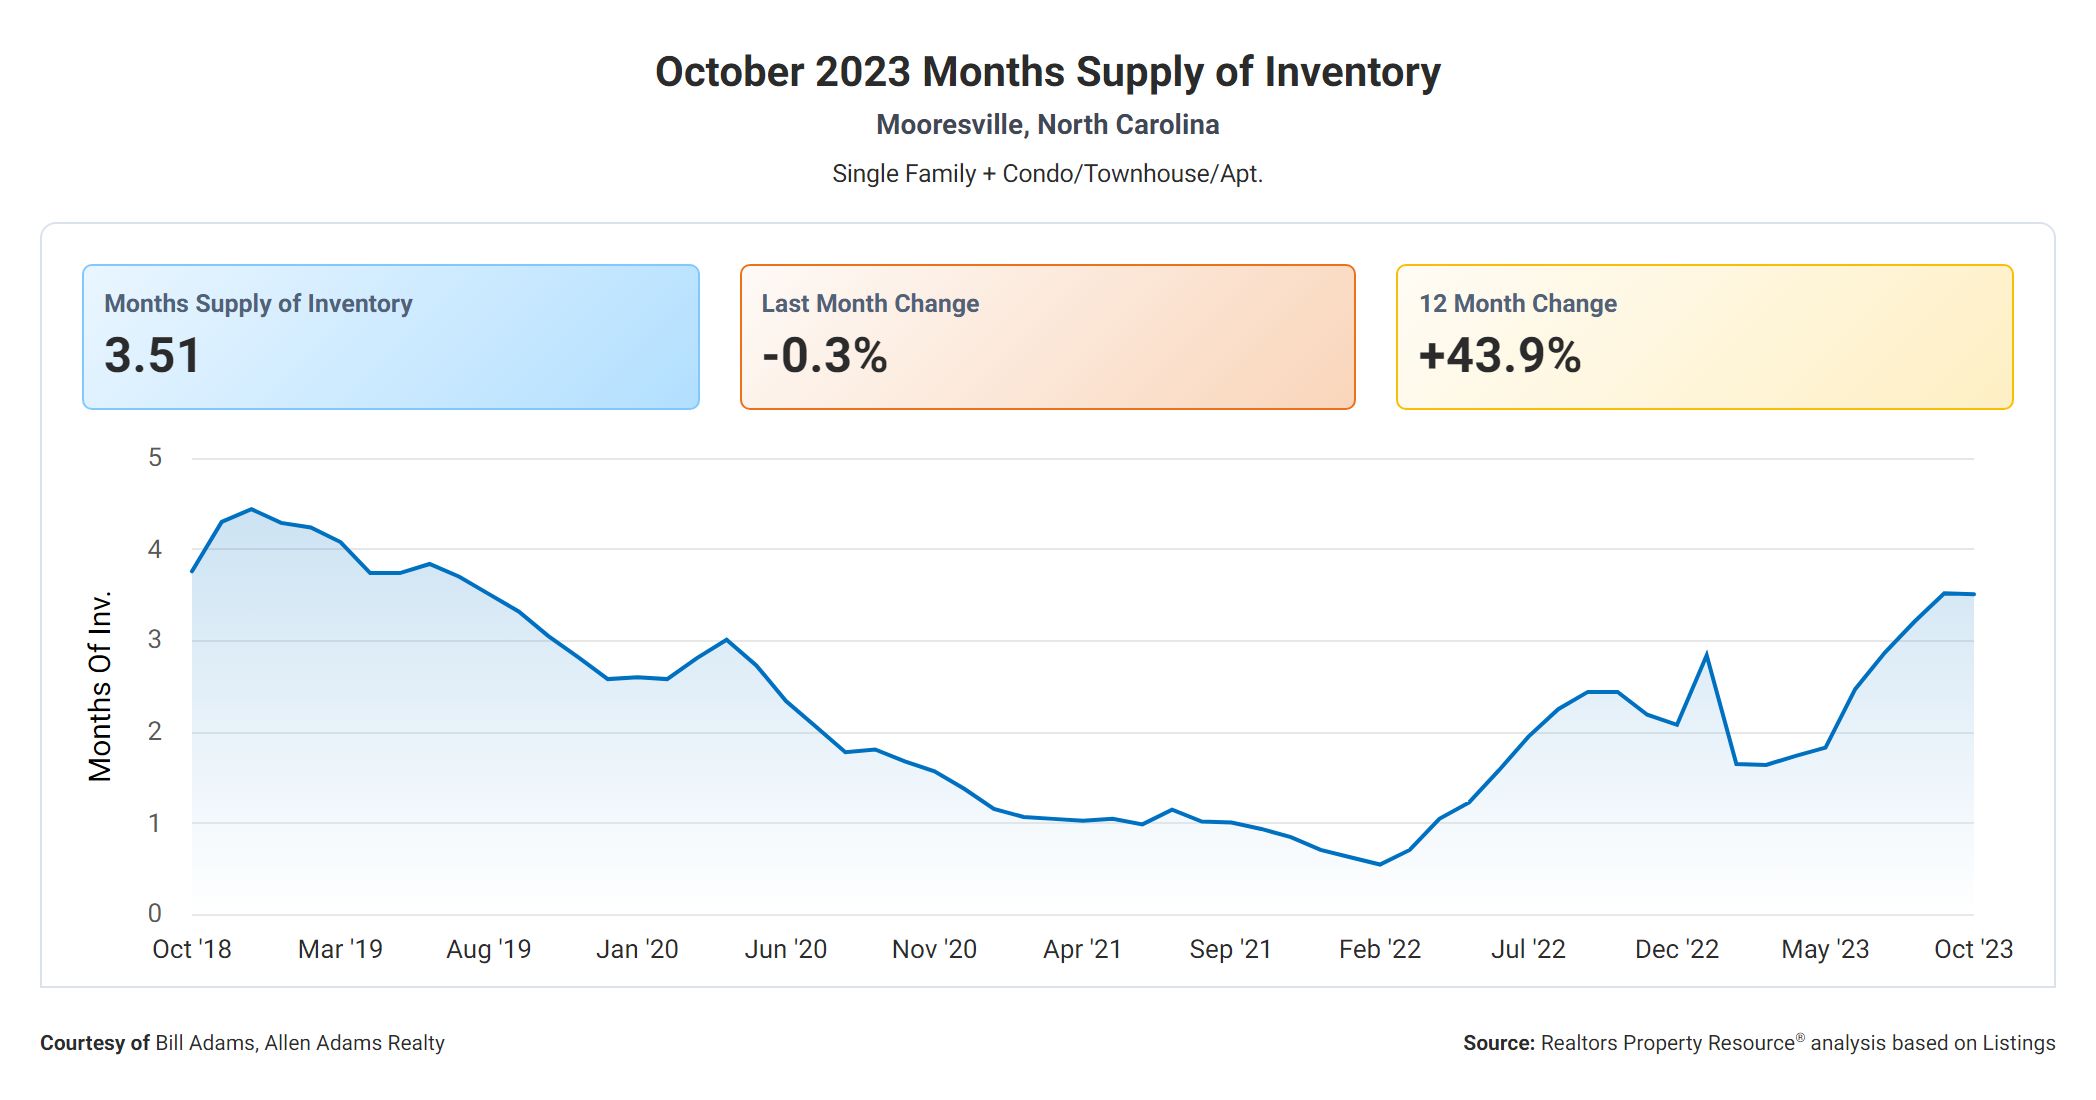
Next, let’s examine the 12-Month Change in Months of Inventory, which is showing a significant increase of +43.85%. This indicates that the inventory of homes for sale has grown over the past year. This increase in supply could potentially shift the market towards a buyer’s market, giving buyers more options to choose from.
Days On Market
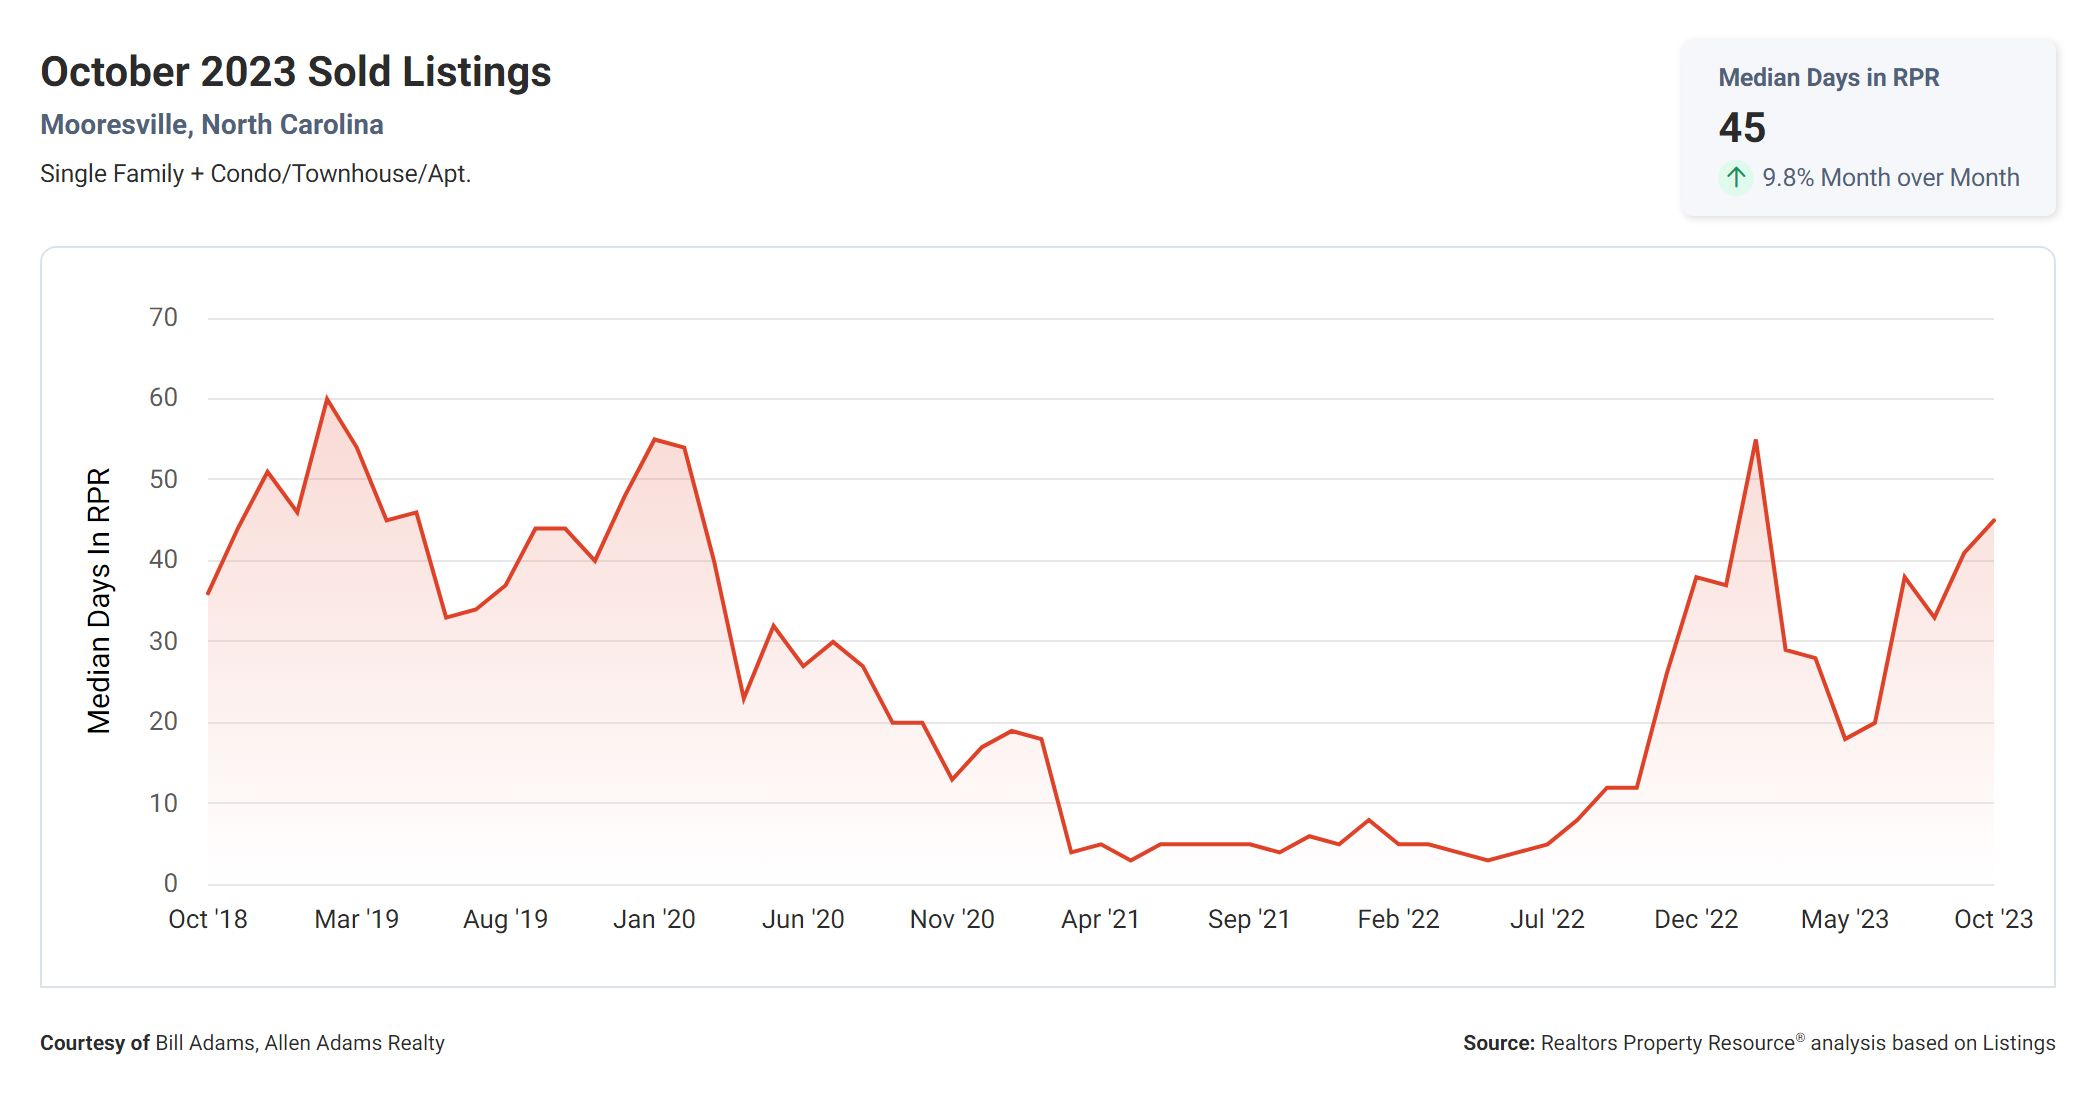
Our next metric is the Median Days Homes are On the Market, we find that it currently stands at 45 days. This metric measures the average number of days it takes for a home to sell once it is listed. A lower number of days on the market generally indicates a strong demand for homes, which can be favorable for sellers.
Sale Price Versus List Price
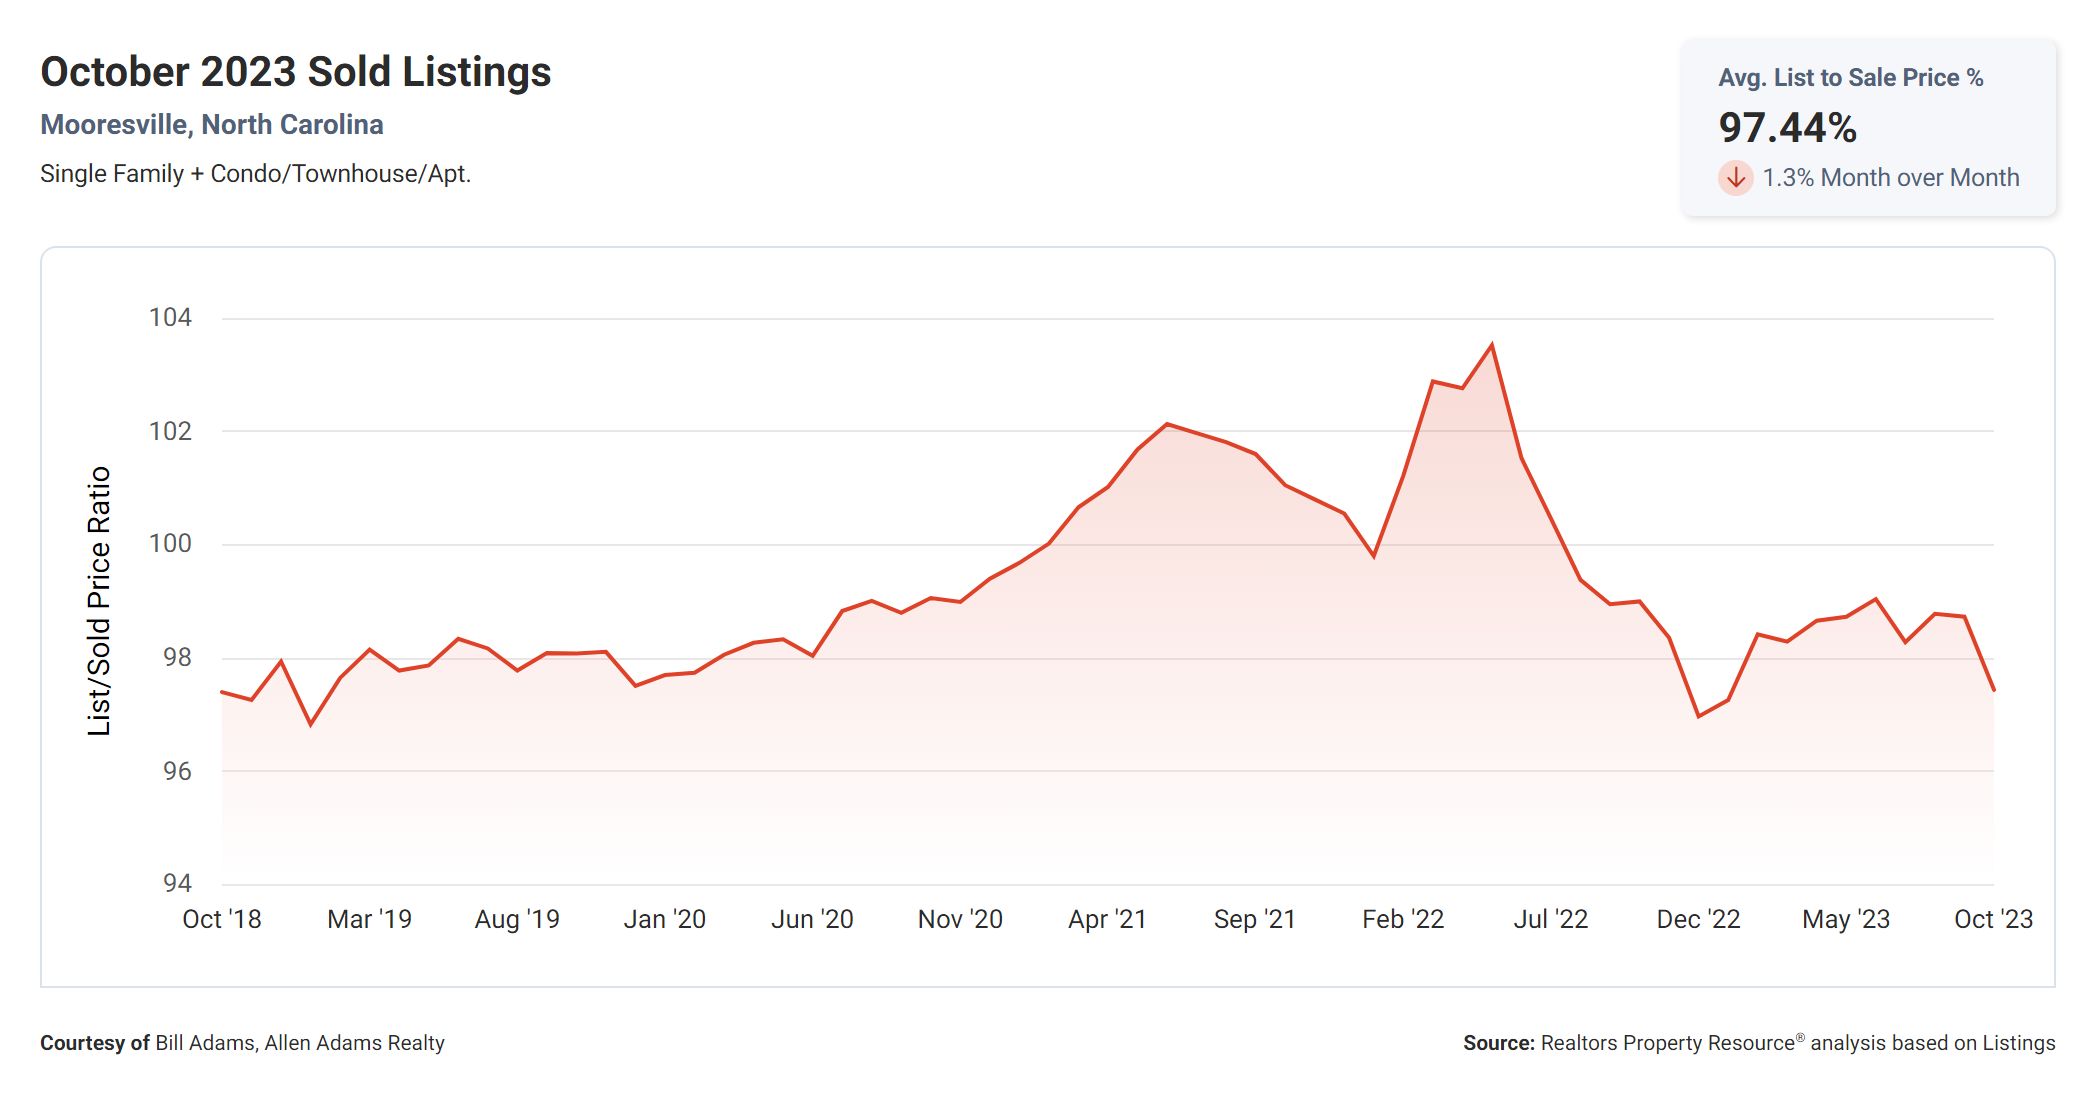
Now let’s talk about the List to Sold Price Percentage, which is currently at 97.4%. This metric represents the percentage of the listing price that a home ultimately sells for. A higher percentage suggests that sellers are receiving offers close to their asking price, which indicates a strong market where buyers are willing to pay the listed price.
Median Sold Price
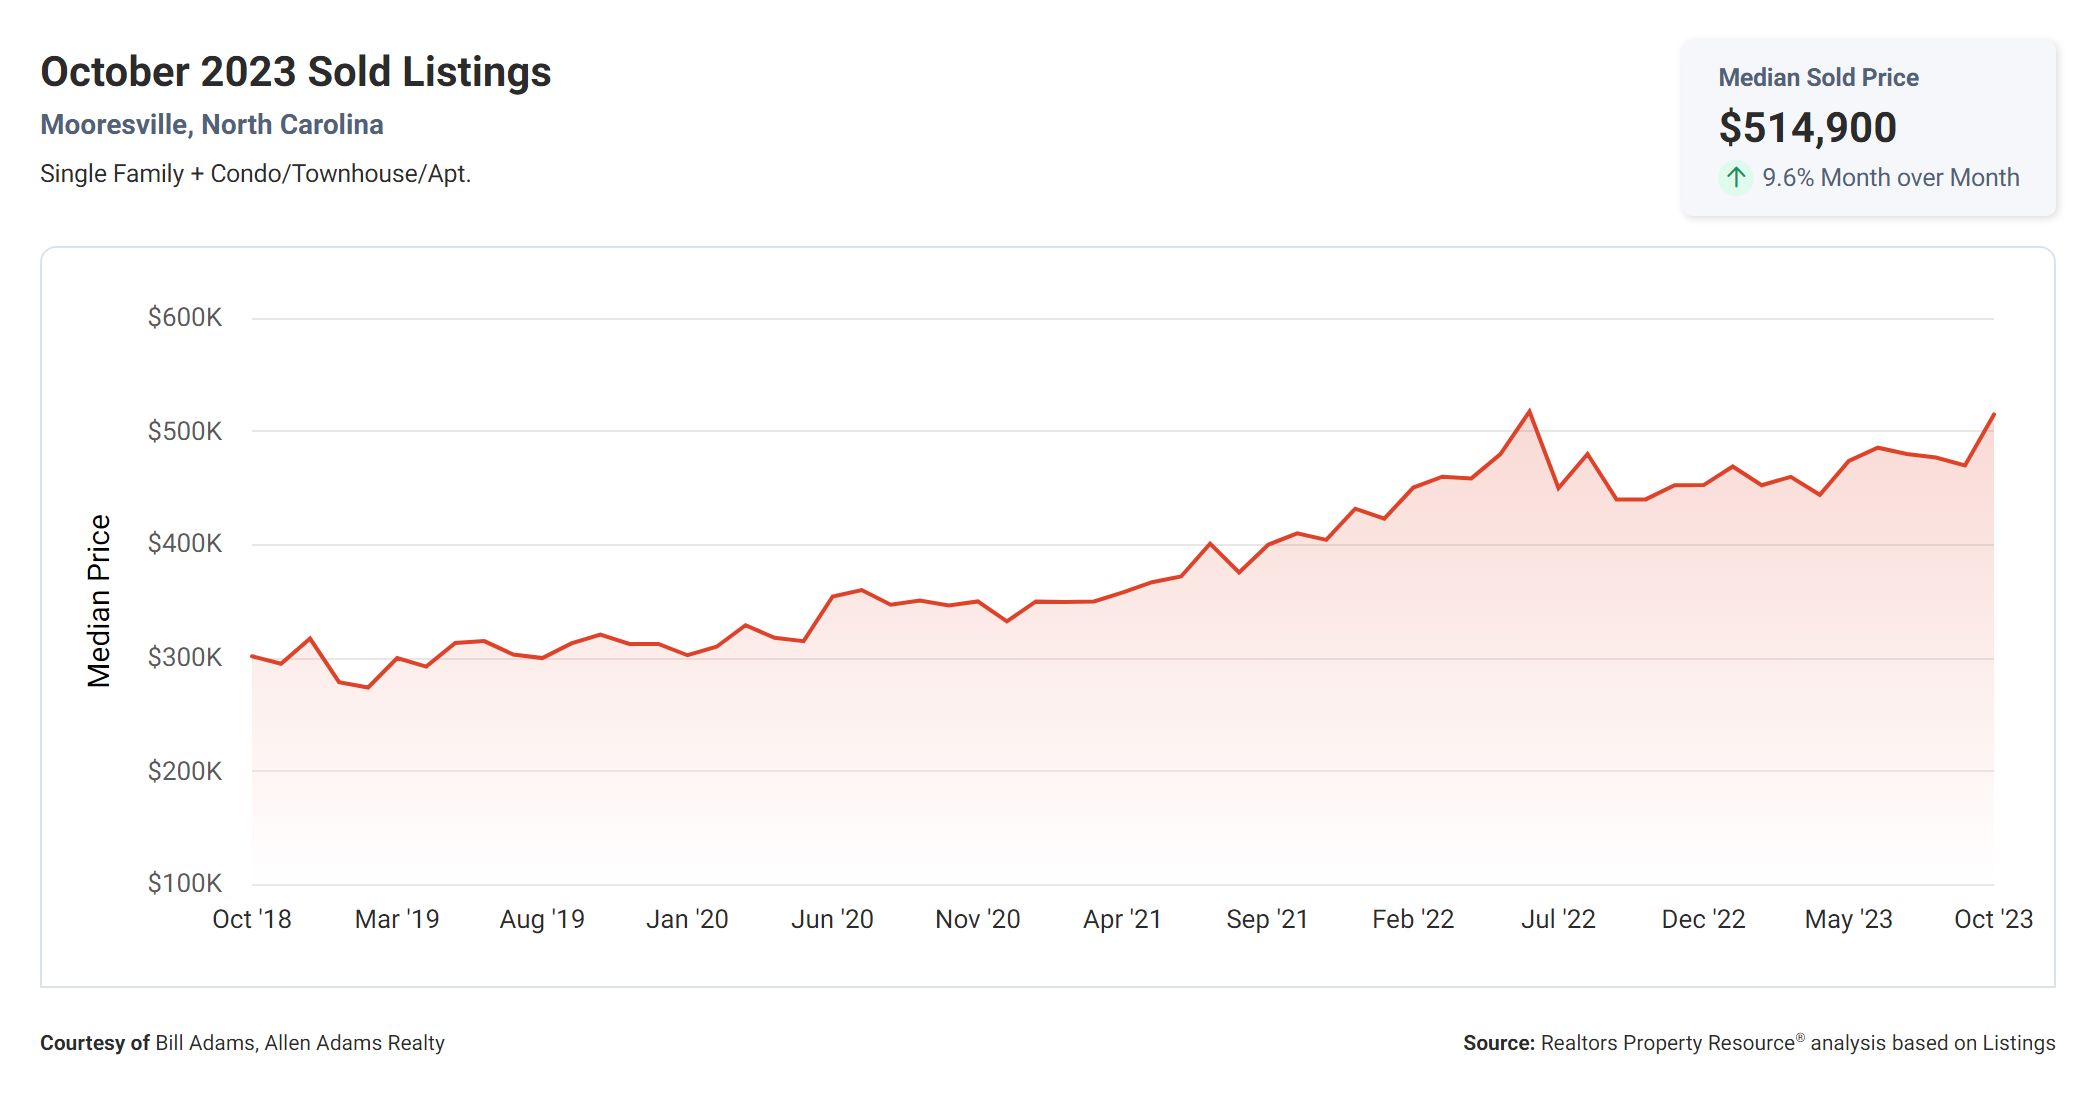
For our final metric, we have the Median Sold Price, which is currently at $514,900. This metric represents the middle point of all the sold prices in a given area. It shows the overall price trends in the market and can be useful for both buyers and sellers to understand the average price range.
What The Numbers Mean
Now, let’s bring all these metrics together and analyze their correlations. With a relatively low Months Supply of Inventory, combined with an increase in the 12-Month Change in Months of Inventory, we can infer that the market may be transitioning from a seller’s market to a more balanced market. This shift may be reflected in the Median Days Homes are On the Market, which is currently at 45 days.
Furthermore, the List to Sold Price Percentage of 97.4% suggests that sellers are still able to negotiate offers close to their asking price, indicating a continued demand for homes. Finally, the Median Sold Price of $514,900 gives buyers and sellers an idea of the current price range in the market.
Conclusion
The Mooresville, NC real estate market shows some interesting changes from September to October 2023. While the months supply of inventory and the 12-month change suggest a slight decrease in housing supply, the increase in median days on the market and decrease in the list to sold price percentage indicate a potential shift towards a more balanced market. The notable increase in the median sold price suggests an overall upward trend in property values. Buyers may find more options, but sellers should be mindful of a changing market dynamic and price competitively.
Ready To Make Mooresville, NC Your Home?
Mooresville, NC Homes For Sale

