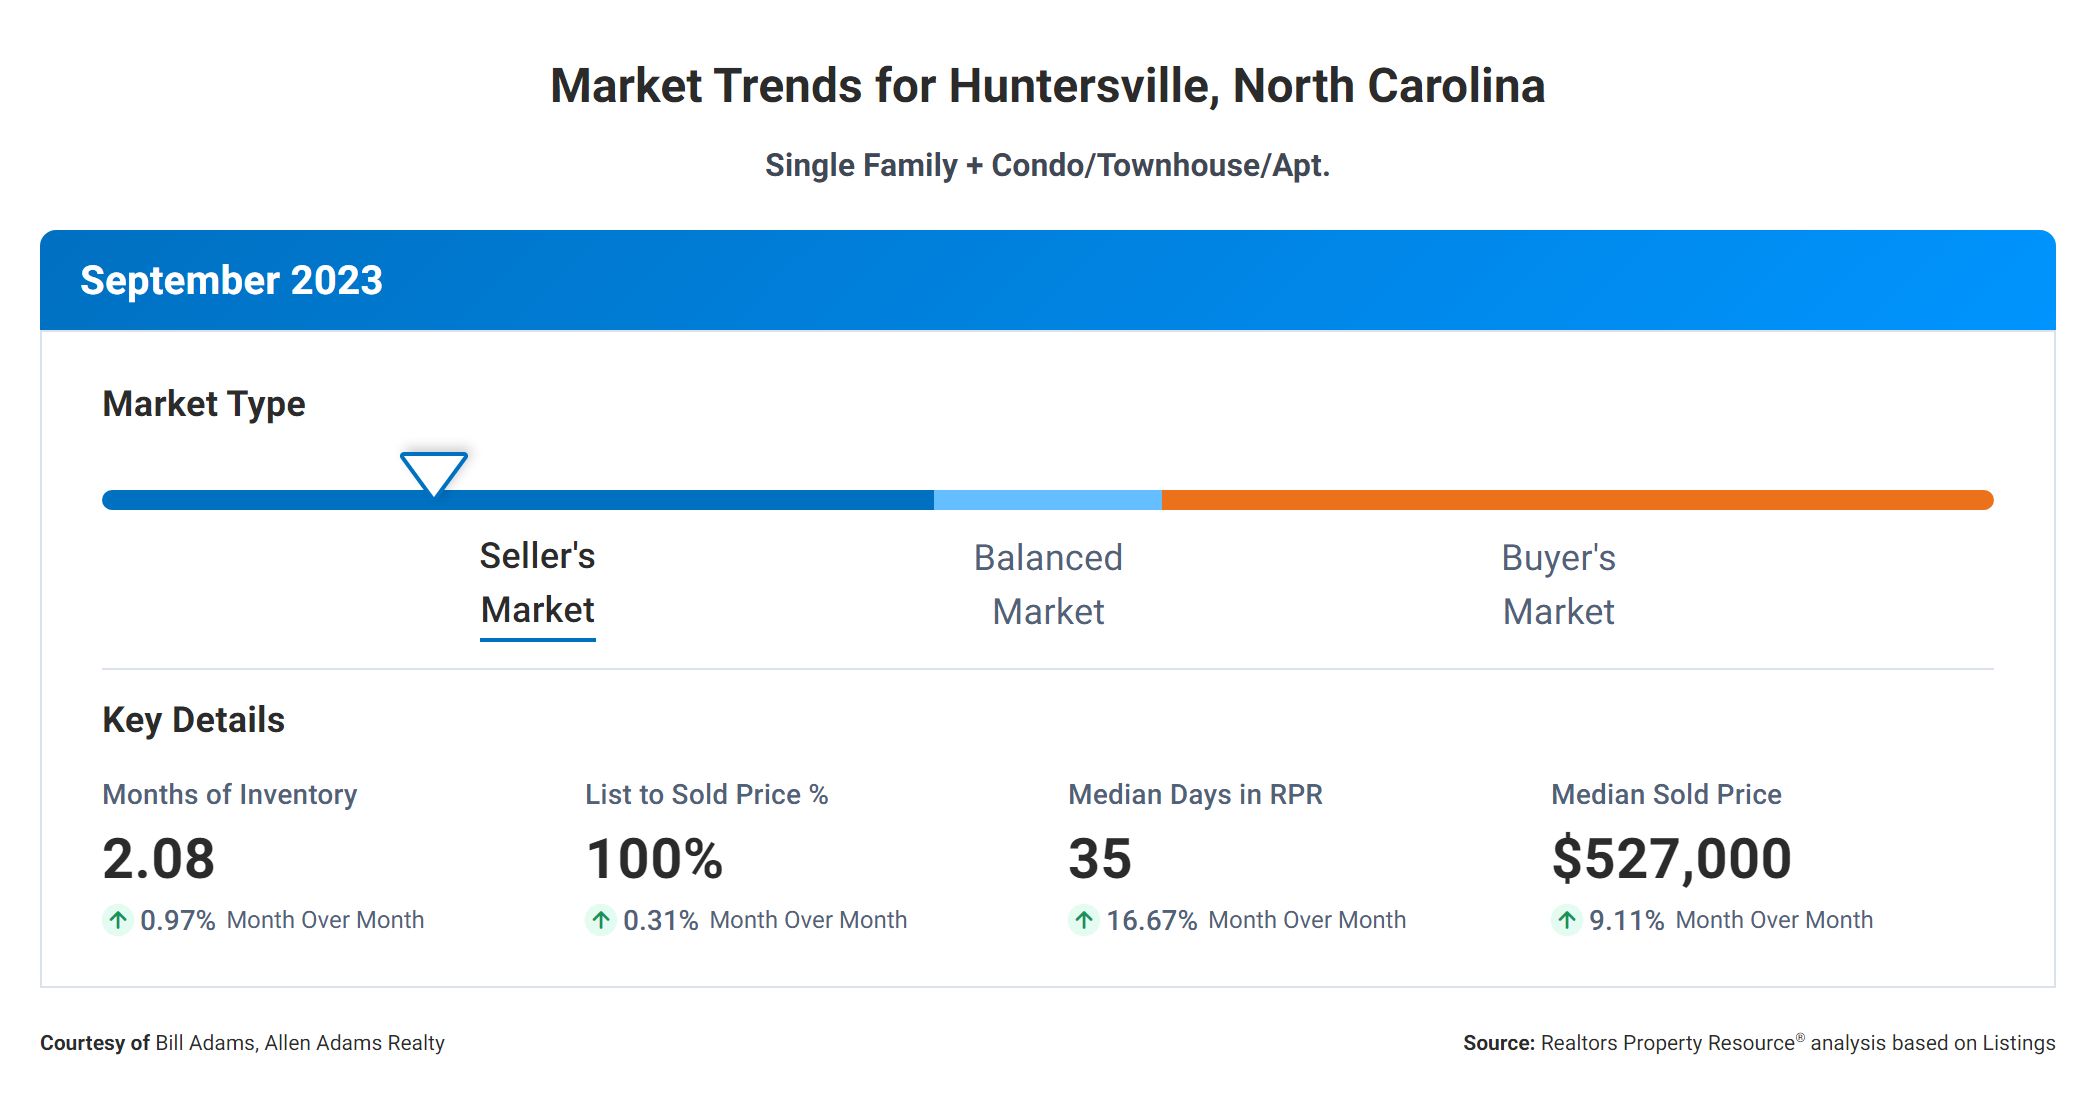
As potential buyers and sellers in the real estate market, it is crucial for you to stay informed about the various metrics that drive this industry. Today, we will delve into the correlation between different real estate metrics for the Huntersville, NC market to provide you with valuable insights and help you make informed decisions.
Months Supply
Let’s start by looking at the Months Supply of Inventory, which currently stands at 2.08. This metric represents the number of months it would take to sell all the available homes on the market if no new listings were added. A lower supply of inventory indicates a seller’s market, where demand outpaces supply, driving prices up.
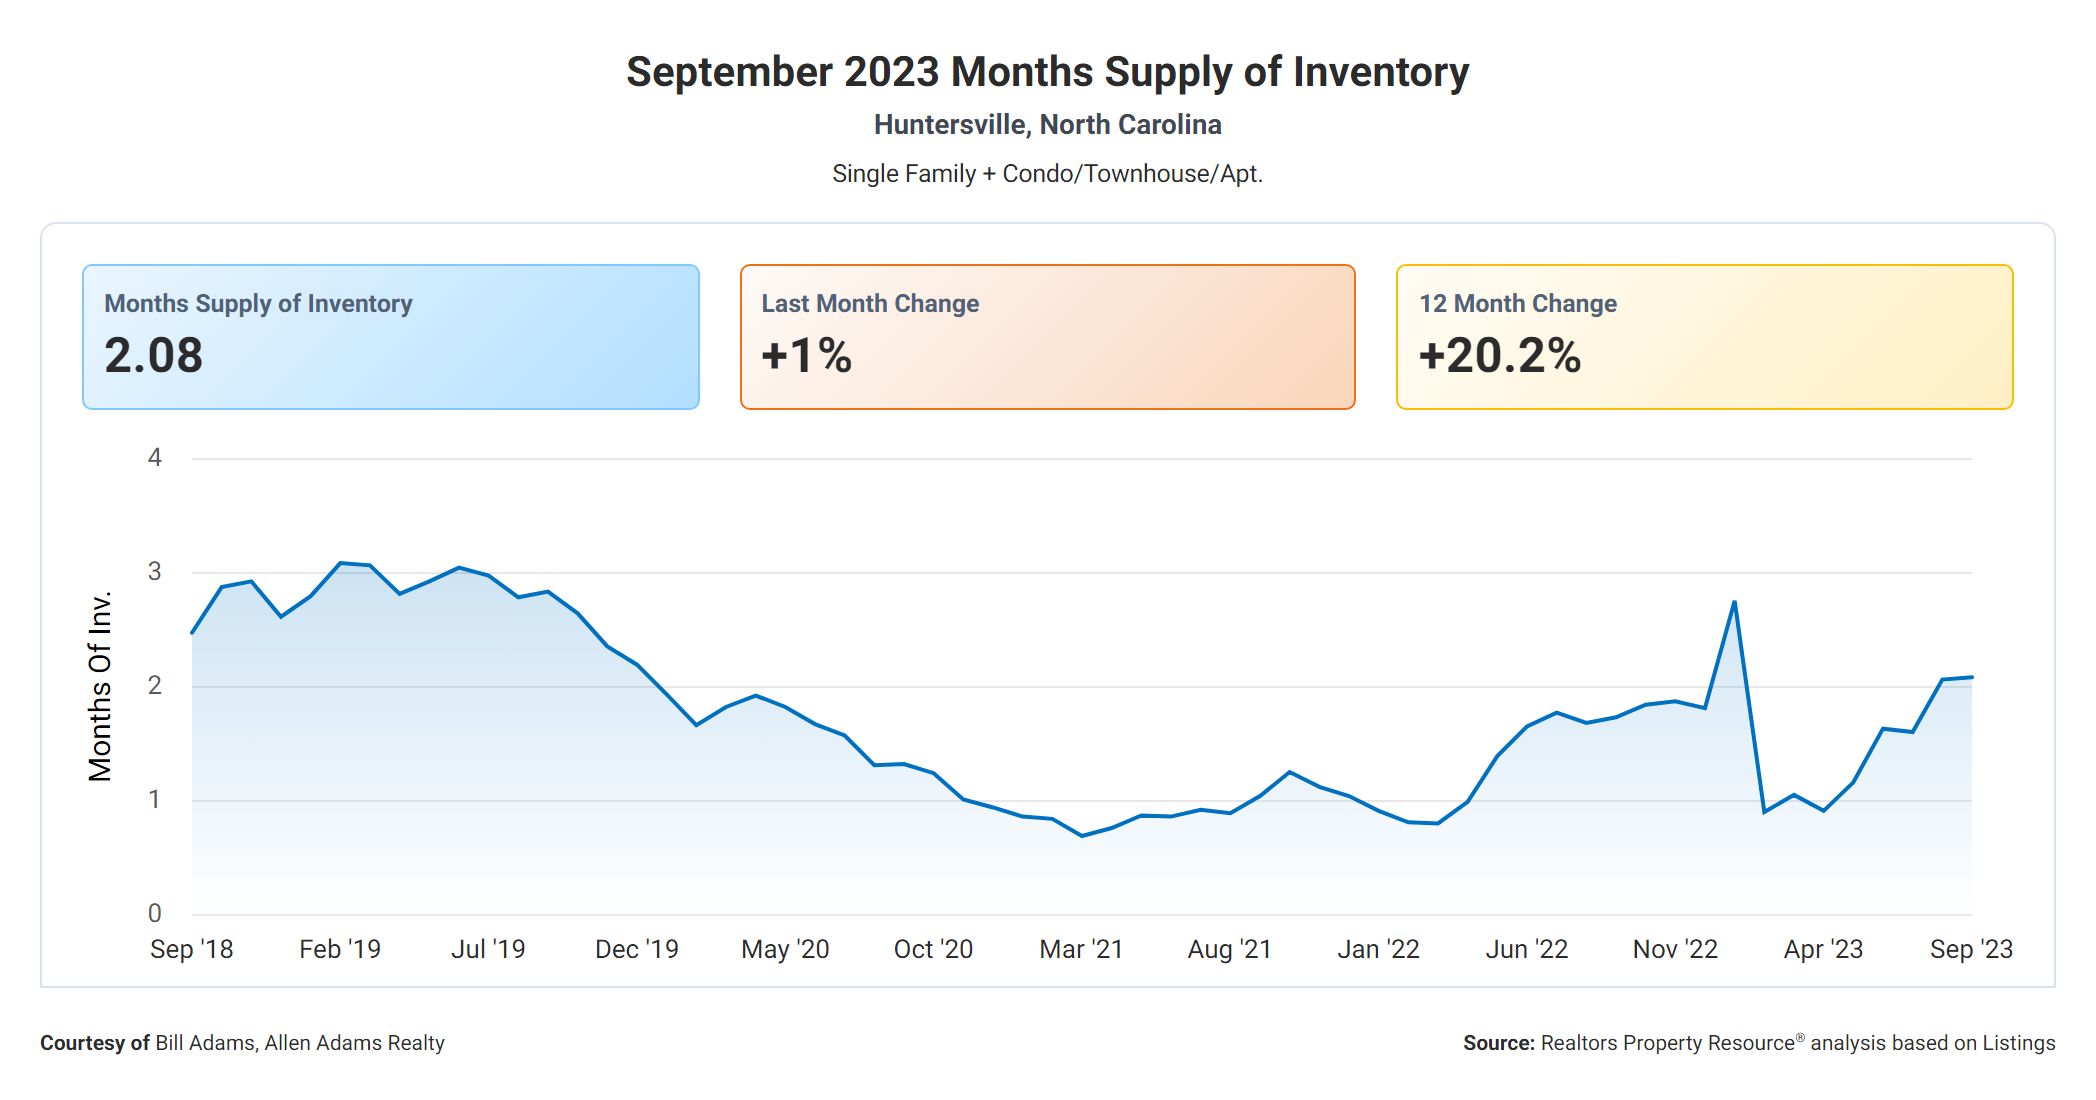
Now, let’s examine the 12-Month Change in Months of Inventory, which shows a significant increase of 20.23%. This suggests that the market has experienced a greater influx of homes for sale in the past year, potentially leading to a more balanced or even a buyer’s market. Buyers may have more options to choose from, potentially giving them more negotiation power.
Days On Market
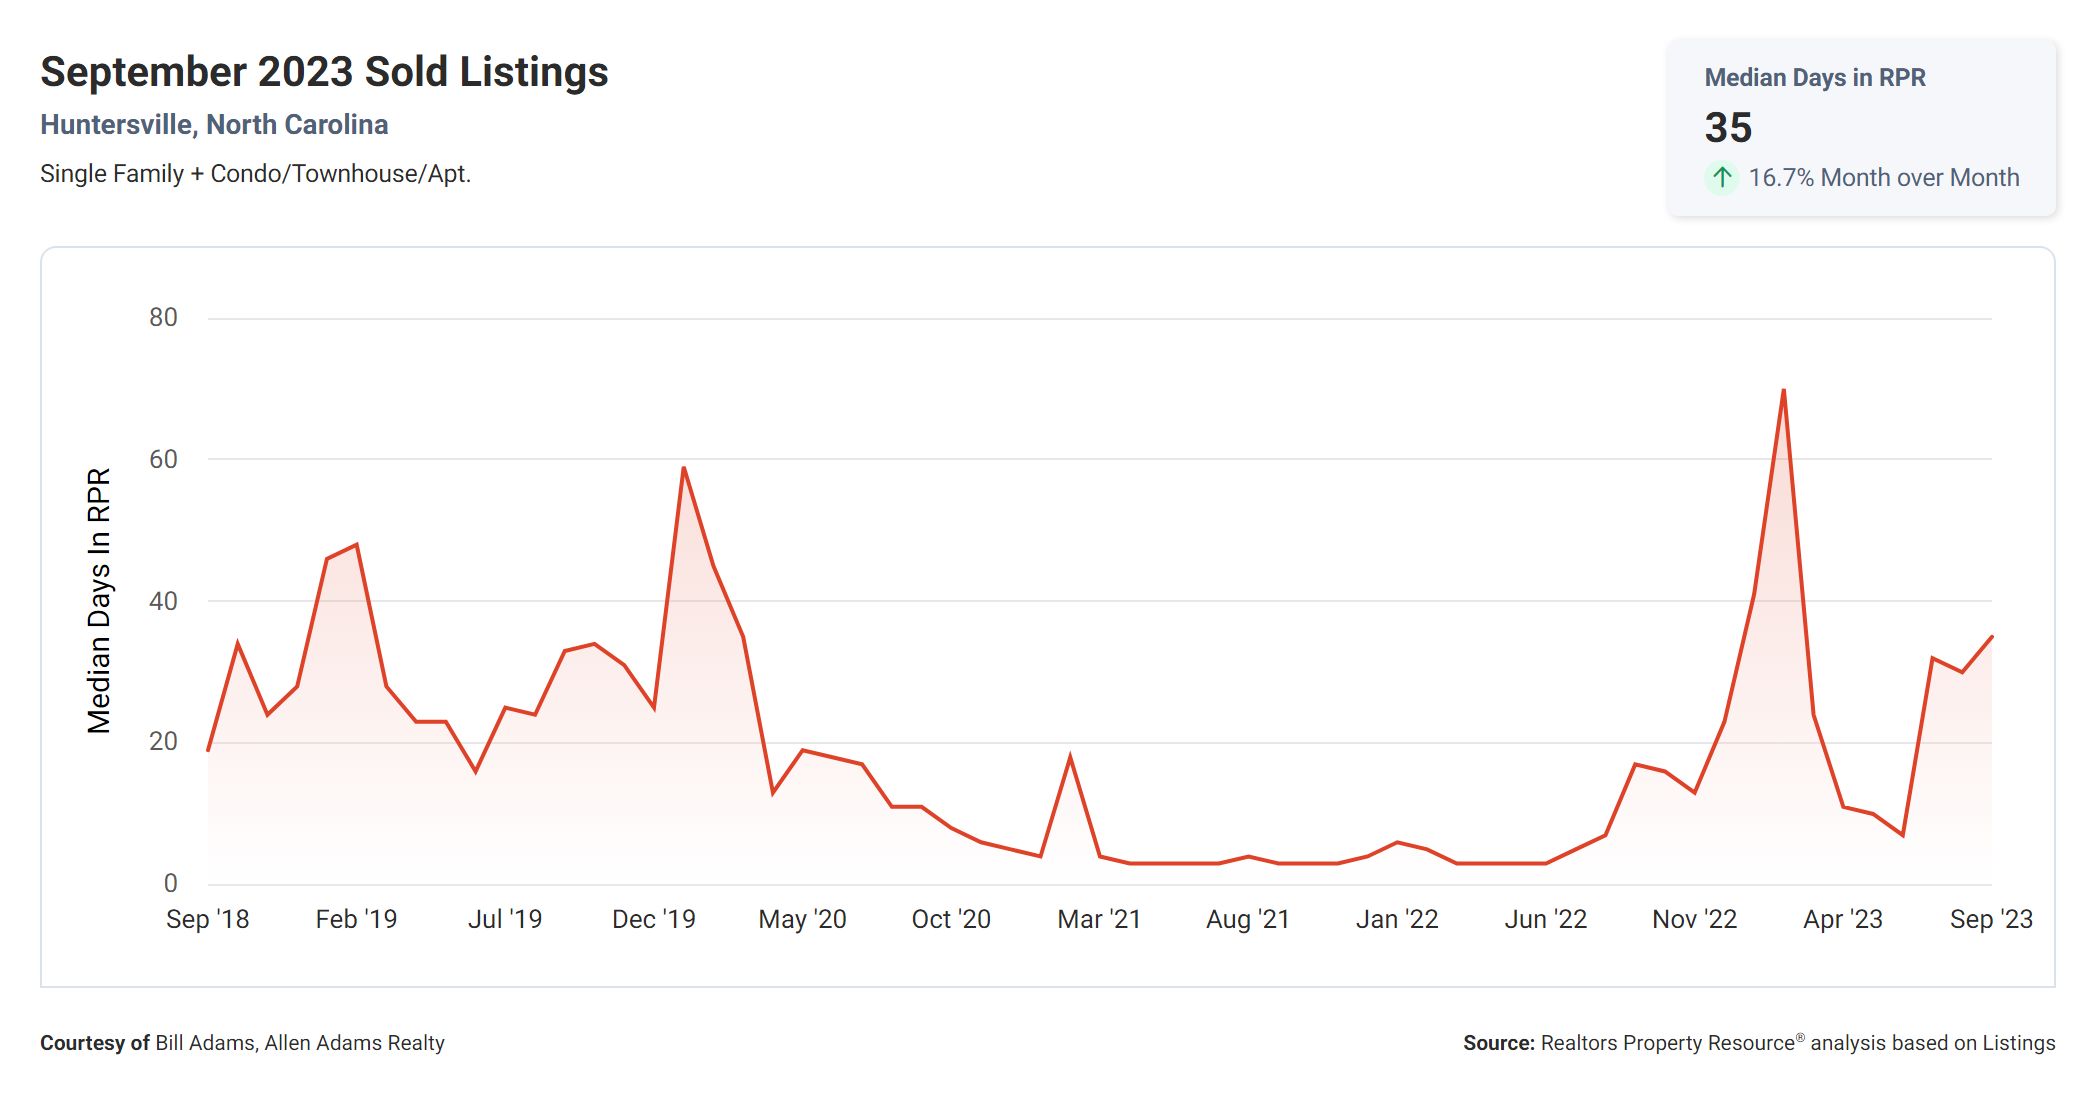
The Median Days Homes are On the Market for Huntersville is 35. This metric provides an insight into the average time it takes for a home to sell. A lower number suggests a faster-paced market, indicating high demand and potentially multiple offers on properties. This can be advantageous for sellers as it indicates a higher likelihood of a quicker sale.
Sale Price Versus List Price
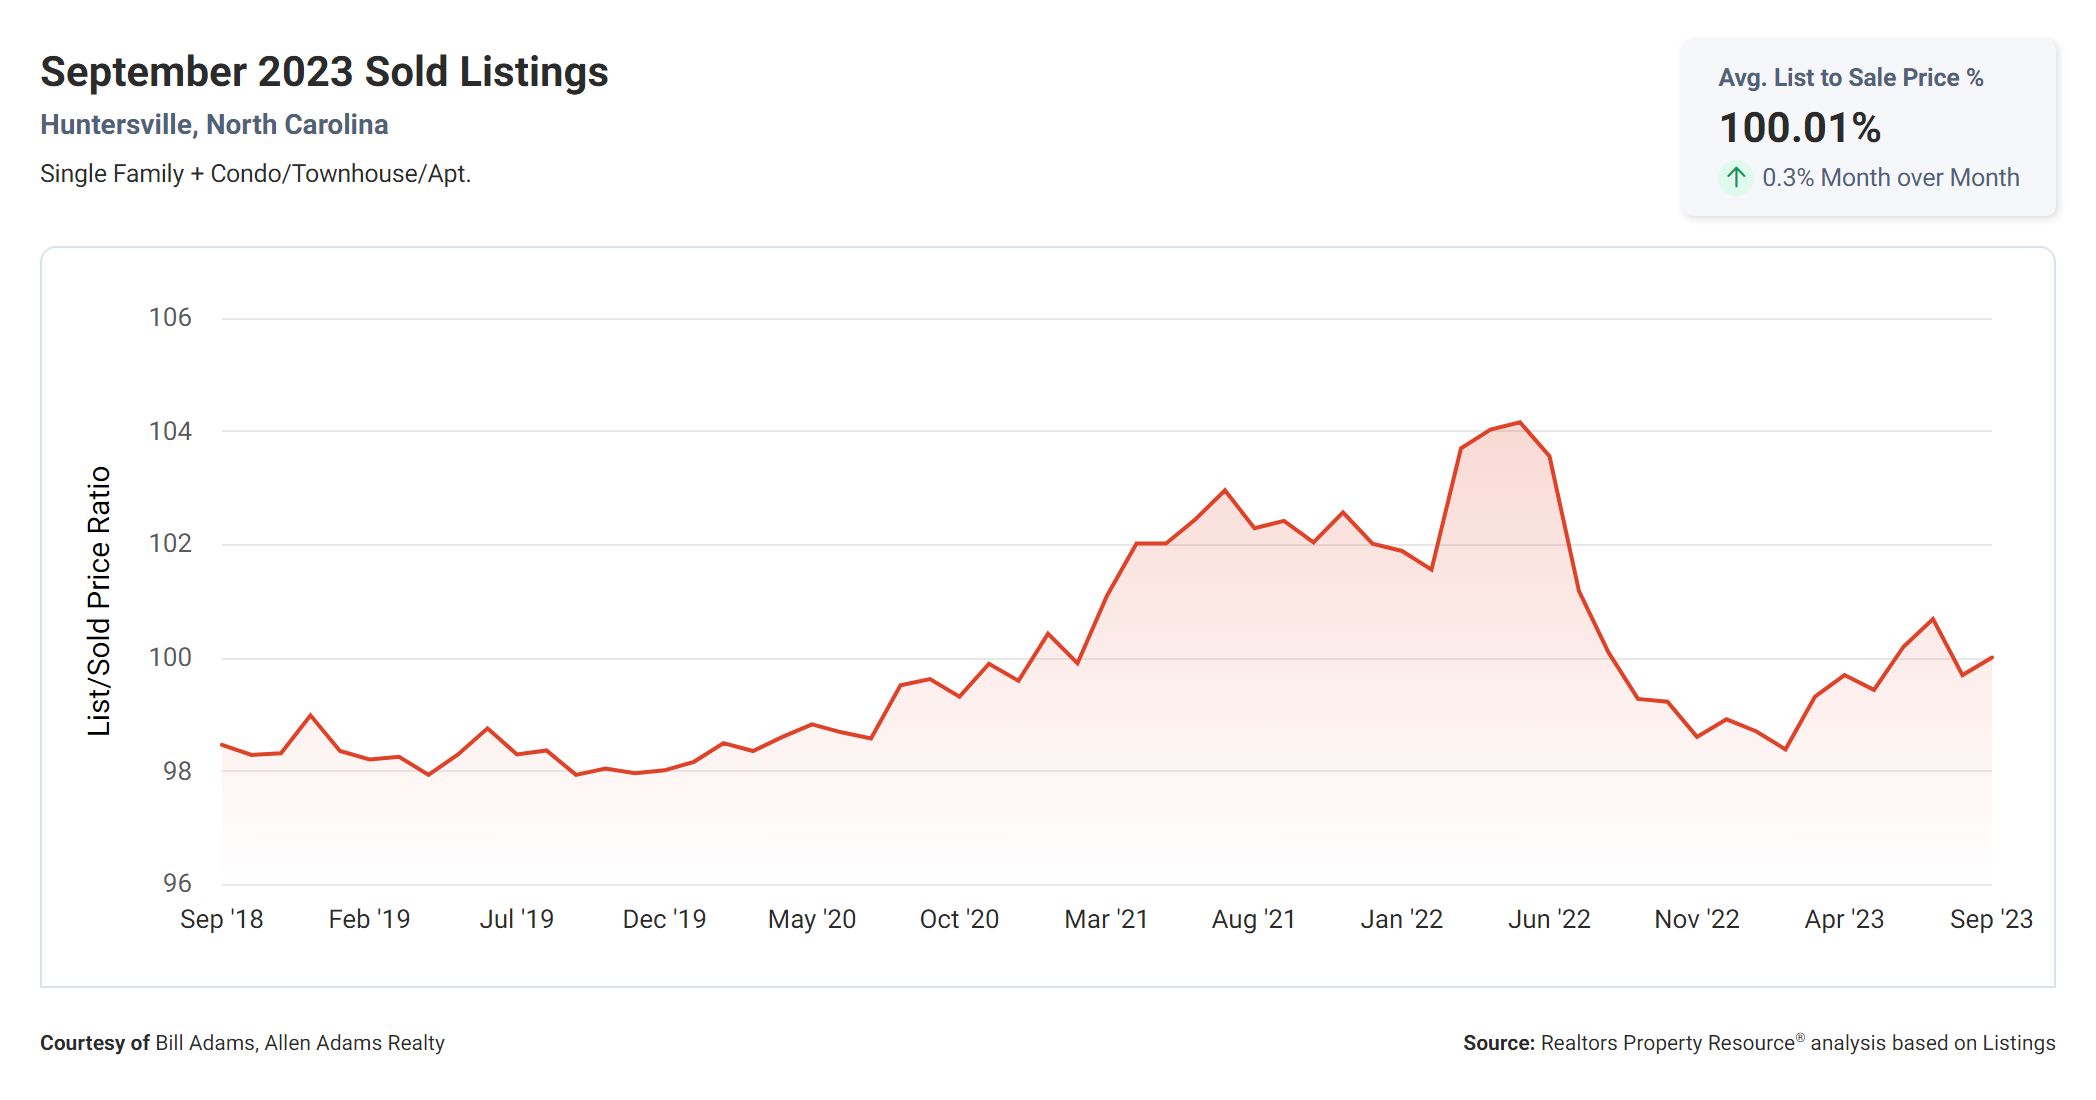
For the List to Sold Price Percentage, which is currently at 100%. This means that, on average, homes are selling for their list price. This is a positive indication for sellers, as it shows that buyers are willing to pay the full asking price. However, buyers may need to be prepared to compete with other buyers and potentially offer the list price or higher to secure a property.
Median Sold Price
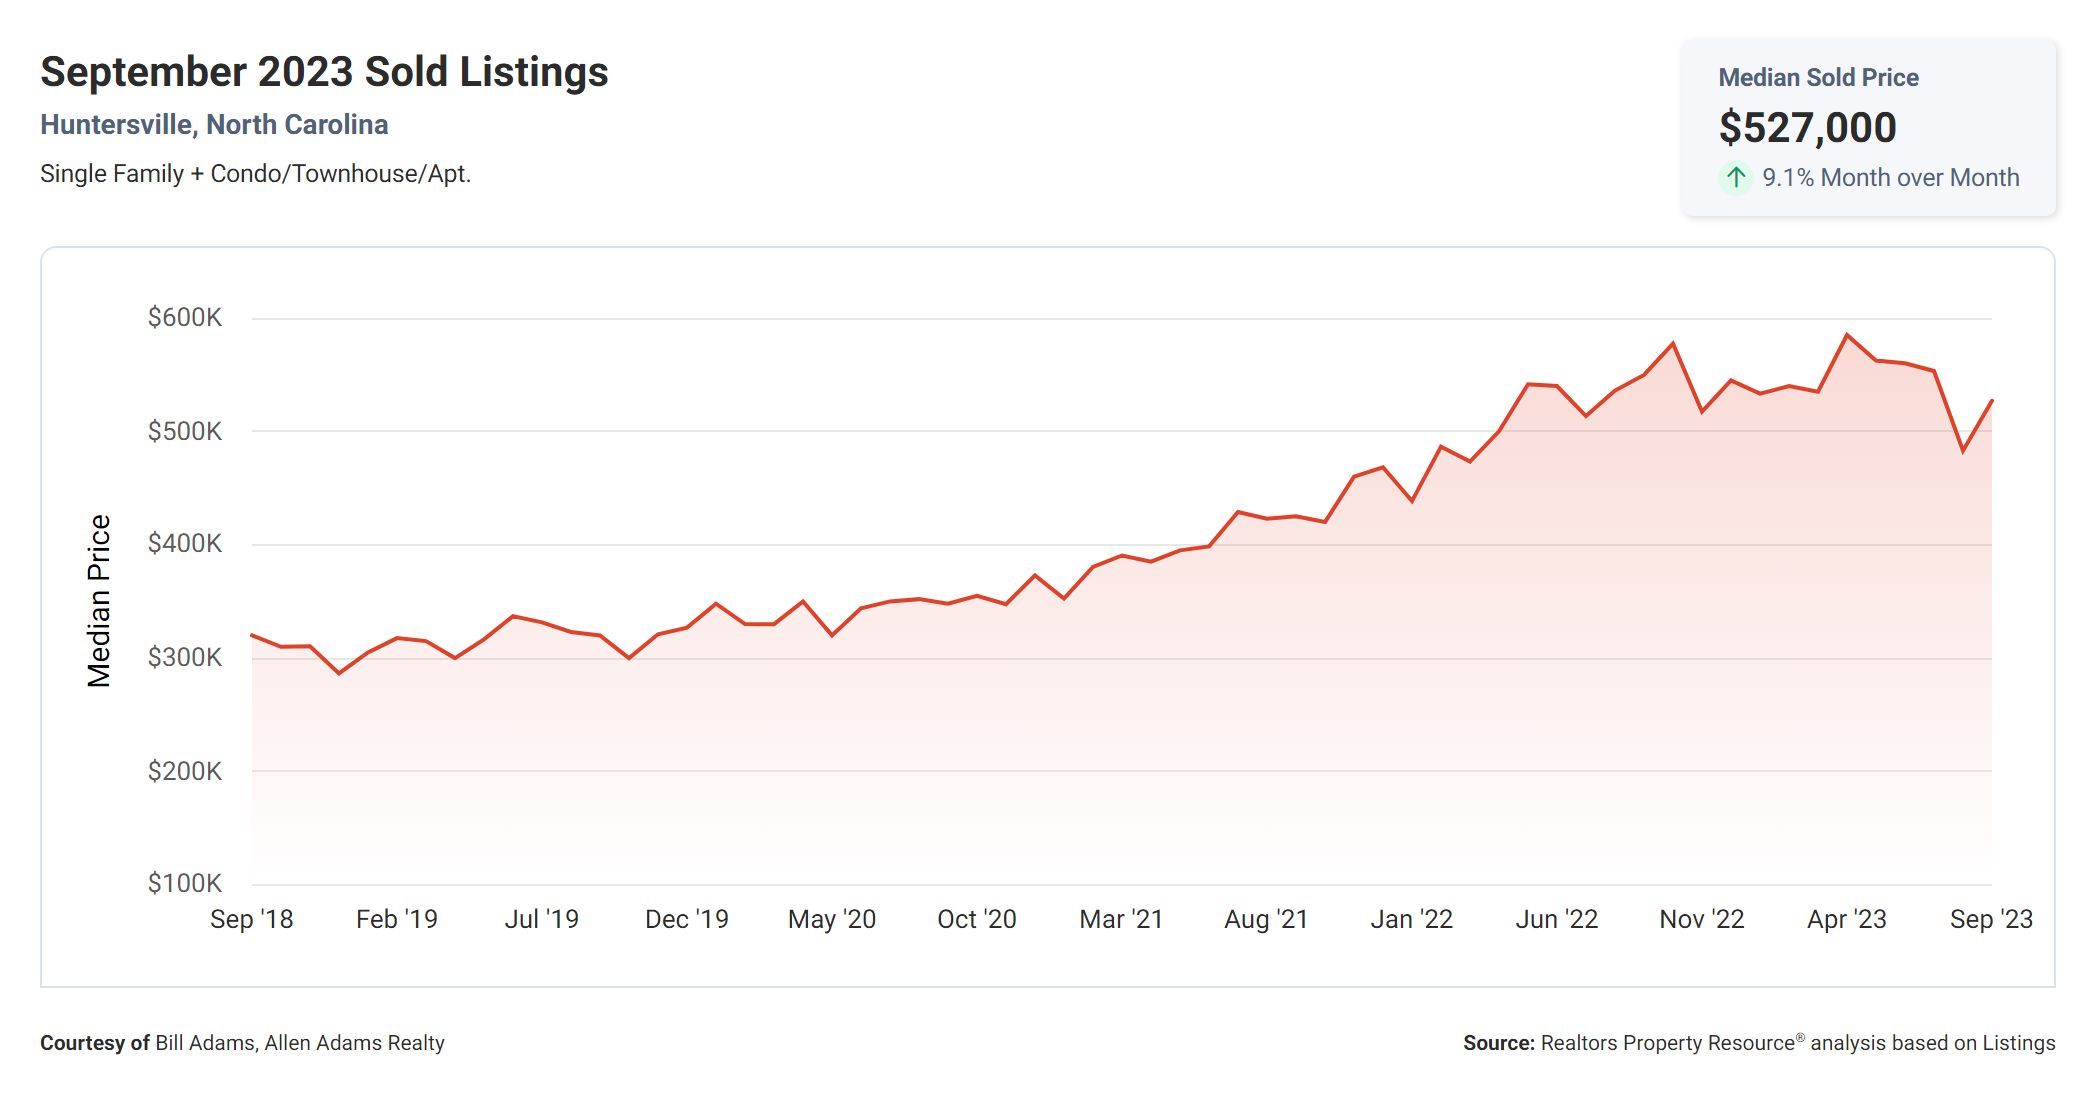
Lastly, we have the Median Sold Price, which stands at $527,000. This metric represents the midpoint of all home prices sold in a given period. It reflects the overall market value and can provide an indication of where the market is heading. A higher median sold price suggests a strong market with increased property values, benefiting sellers. However, buyers should be aware that they may need to consider their budget and potentially negotiate to secure a property within their price range.
What The Numbers Mean
In summary, the correlation between these real estate metrics indicates a dynamic market with certain factors favoring both buyers and sellers. The increase in the Months Supply of Inventory over the past year suggests a potentially more balanced market, giving buyers more options. However, the low Median Days on the Market and List to Sold Price Percentage indicate a strong demand, benefiting sellers. Ultimately, it is crucial for both buyers and sellers to stay informed and work with experienced professionals to navigate this ever-changing real estate landscape.
If you would like to see Huntersville listings of homes for sale or learn more about the area click here.

