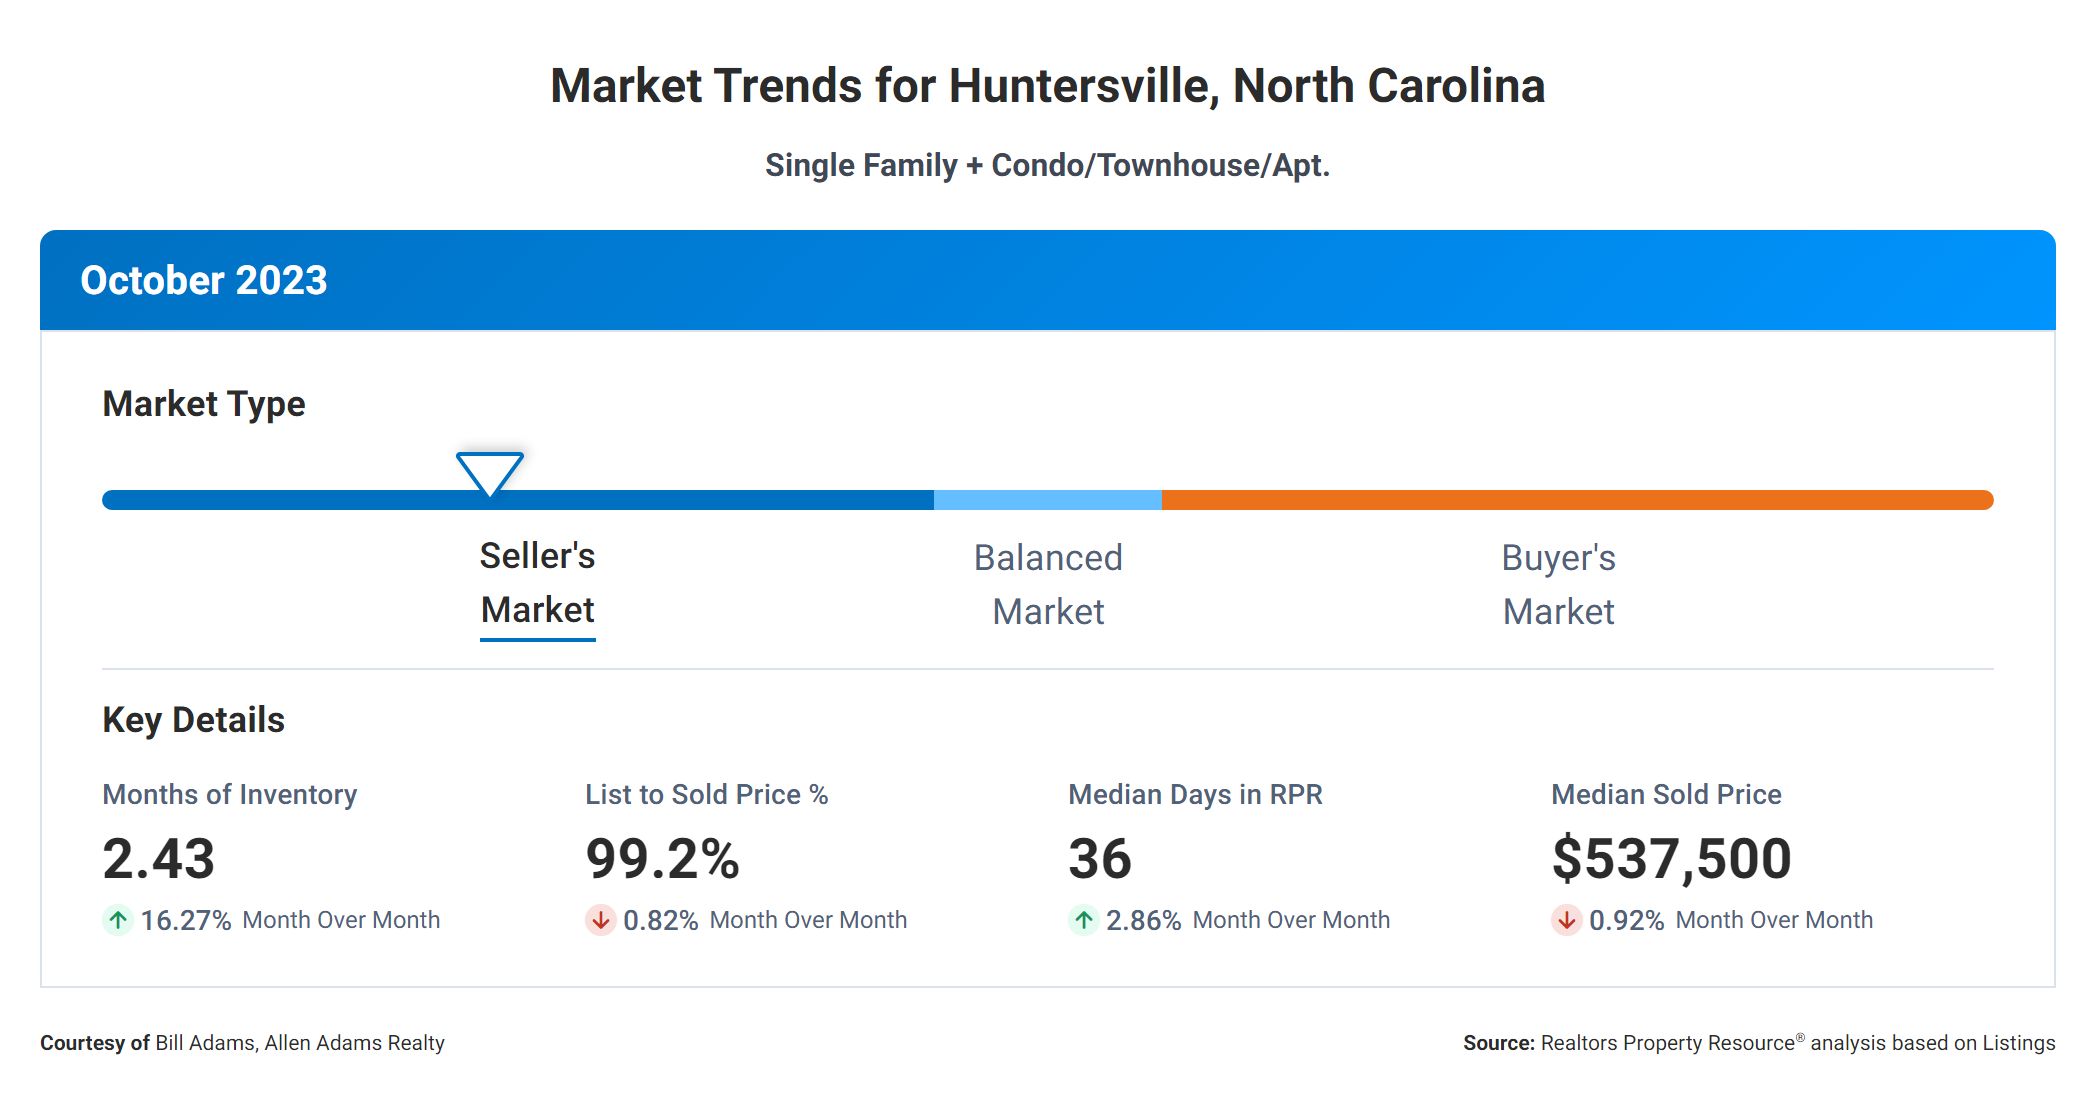
When it comes to understanding the current Huntersville real estate market, there are a few key metrics that can provide valuable insights for both buyers and sellers. Let’s dive into the correlation between these metrics and explore what they mean for you.
Months Supply
First, let’s take a look at the “Months Supply of Inventory,” which currently stands at 2.43. This metric represents the number of months it would take to sell all the available homes on the market if no new listings were added. A lower number indicates a seller’s market, where demand is high and supply is limited. With a months supply of inventory at 2.43, this suggests a competitive market where buyers may need to act quickly to secure a home.
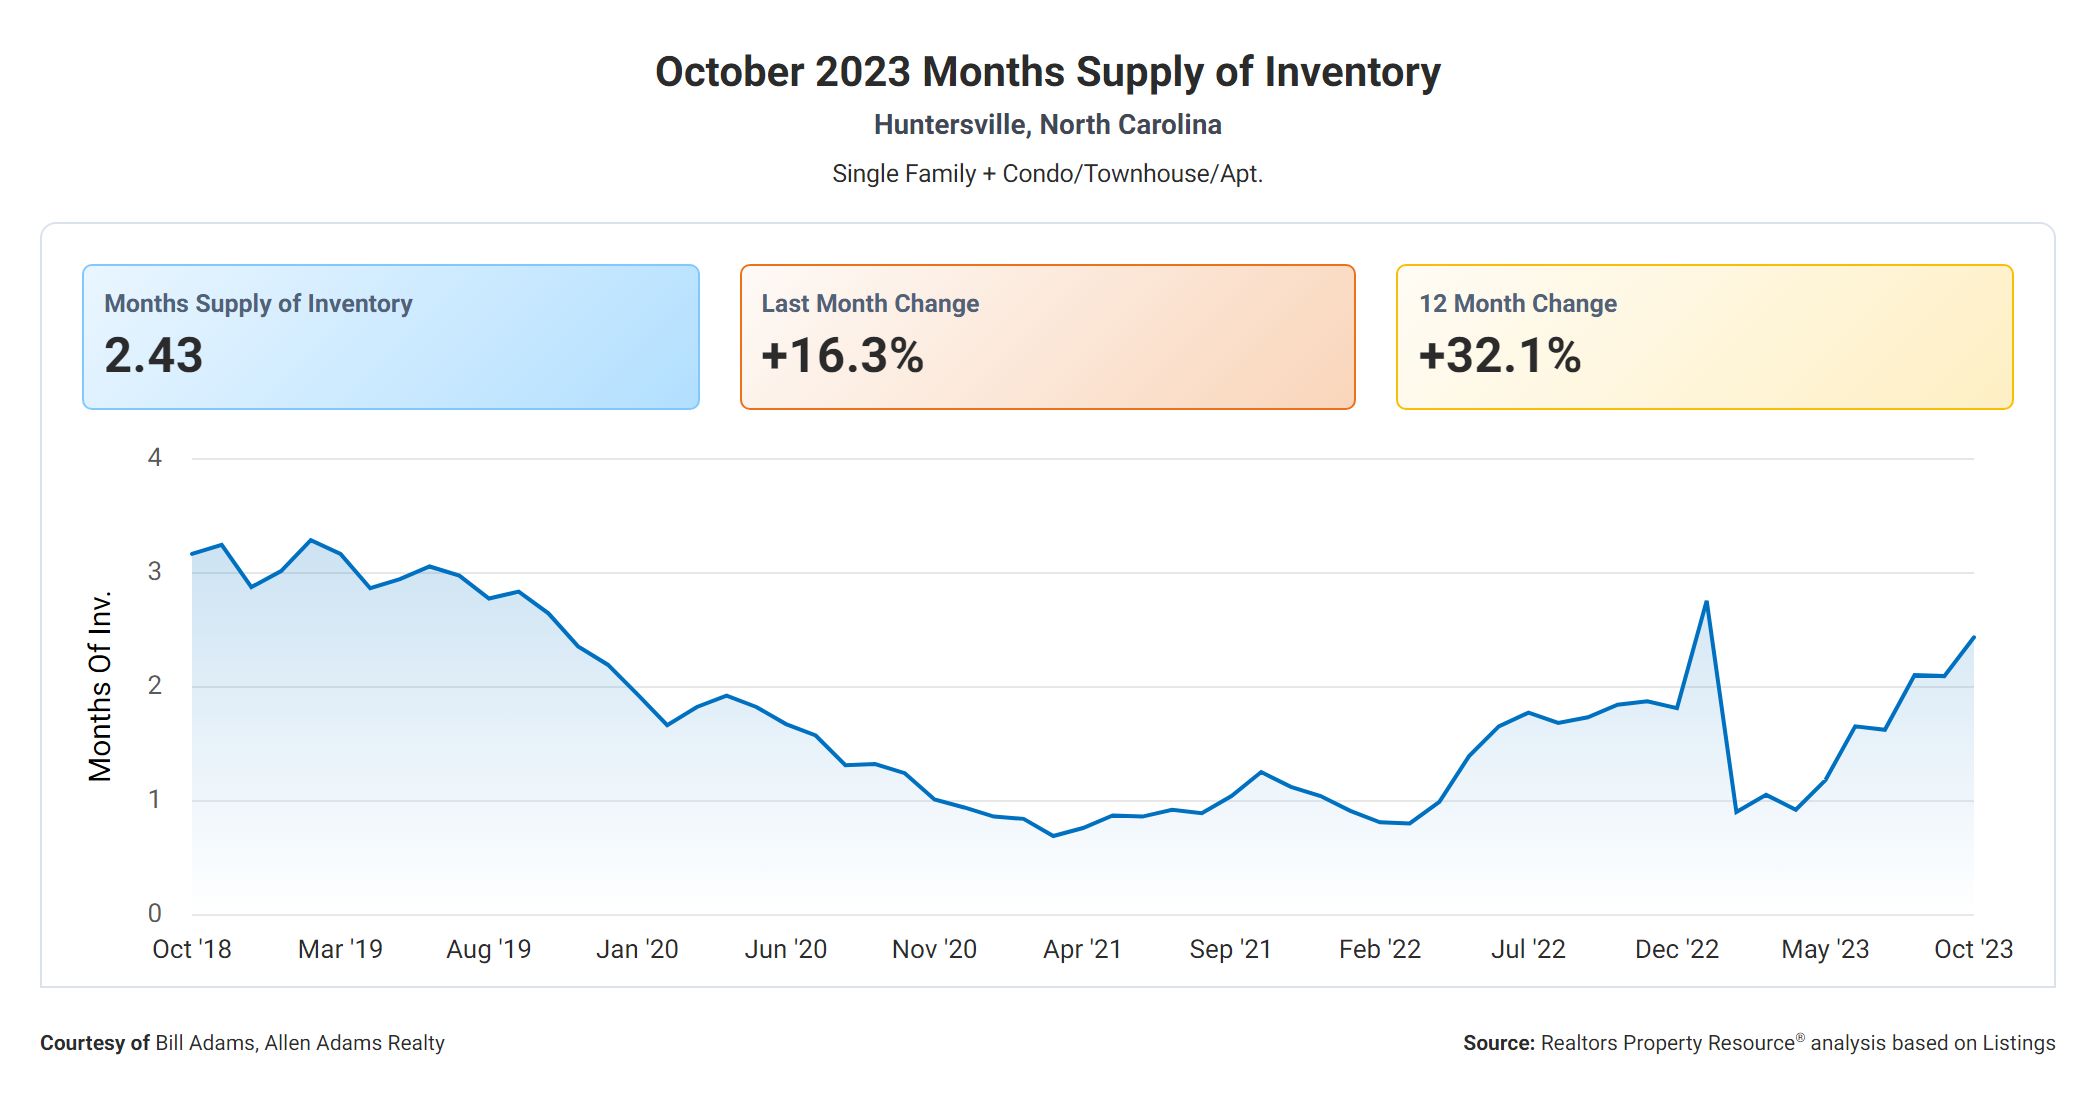
Next, we have the “12-Month Change in Months of Inventory,” which is at +32.07%. This metric provides insight into how the market has evolved over the past year. A positive percentage indicates an increase in available inventory, potentially pointing to a shift towards a more balanced market. This change may provide buyers with more options and slightly less competition than in the previous year.
Days On Market
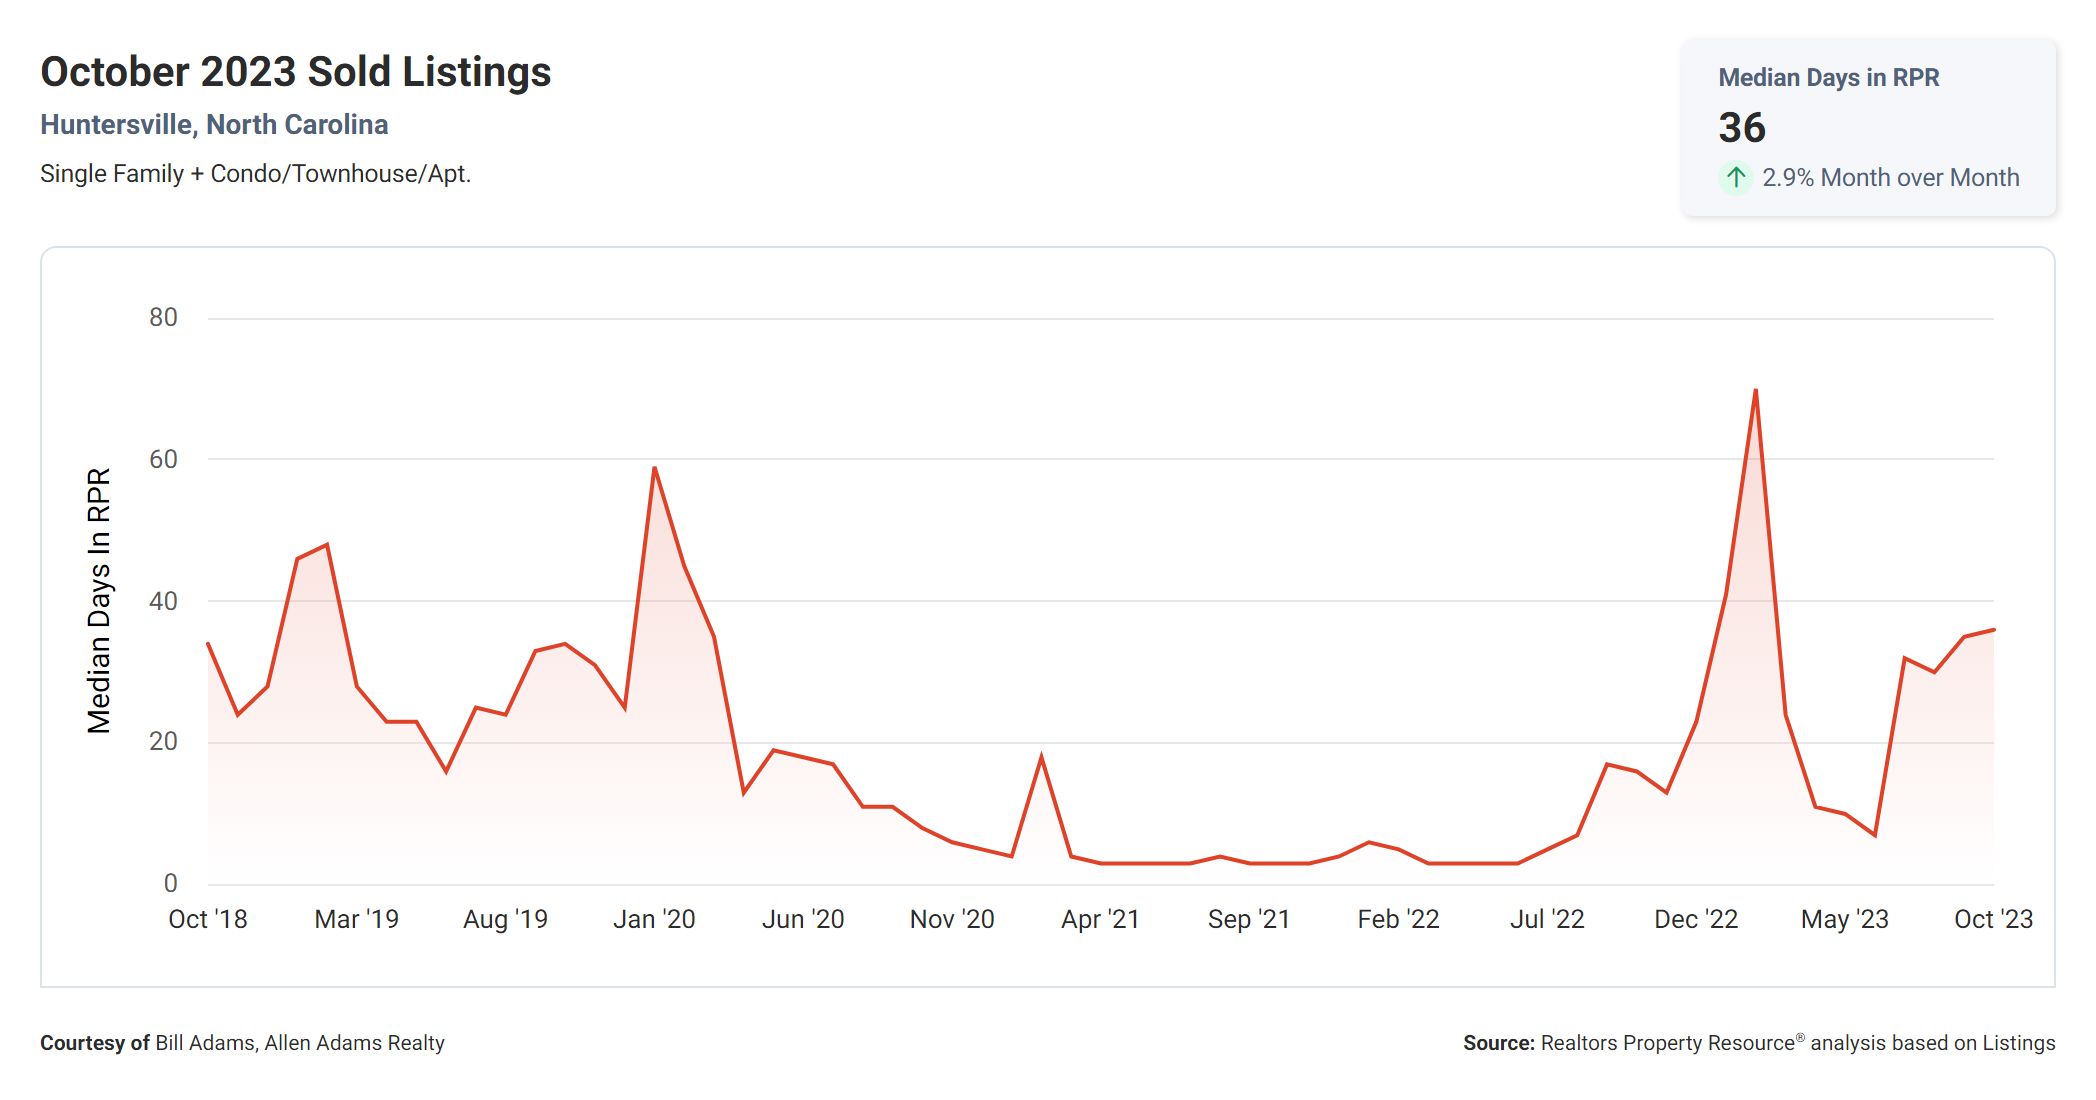
Next, we have the “12-Month Change in Months of Inventory,” which is at +32.07%. This metric provides insight into how the market has evolved over the past year. A positive percentage indicates an increase in available inventory, potentially pointing to a shift towards a more balanced market. This change may provide buyers with more options and slightly less competition than in the previous year.
Sale Price Versus List Price
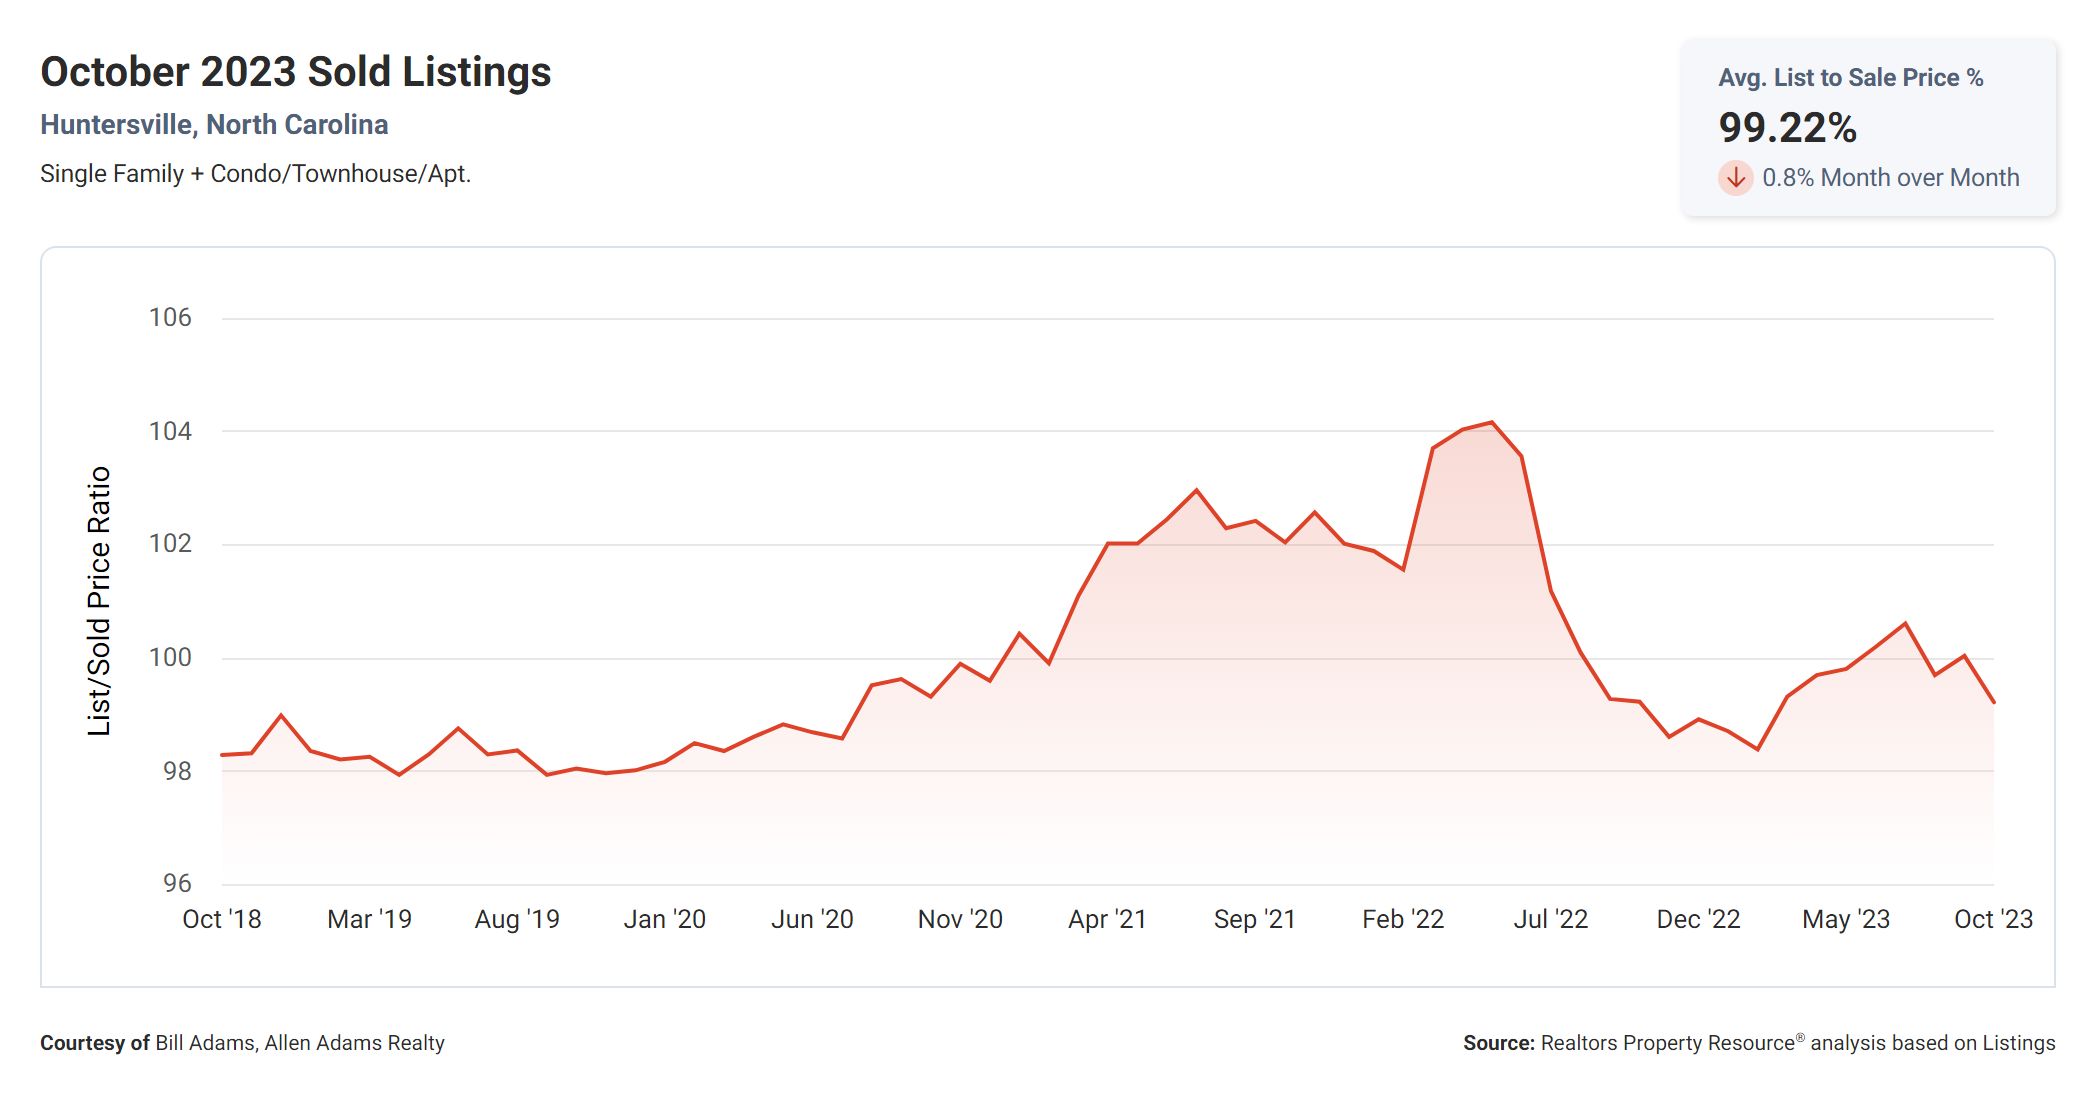
Now, let’s consider the “List to Sold Price Percentage,” which sits at 99.2%. This metric represents the percentage of the listing price that sellers are typically able to sell their homes for. A higher percentage indicates that sellers are receiving offers close to their asking price. With a list to sold price percentage of 99.2%, it suggests that sellers are generally able to negotiate offers very close to their initial listing price, providing them with a strong position in negotiations.
Median Sold Price
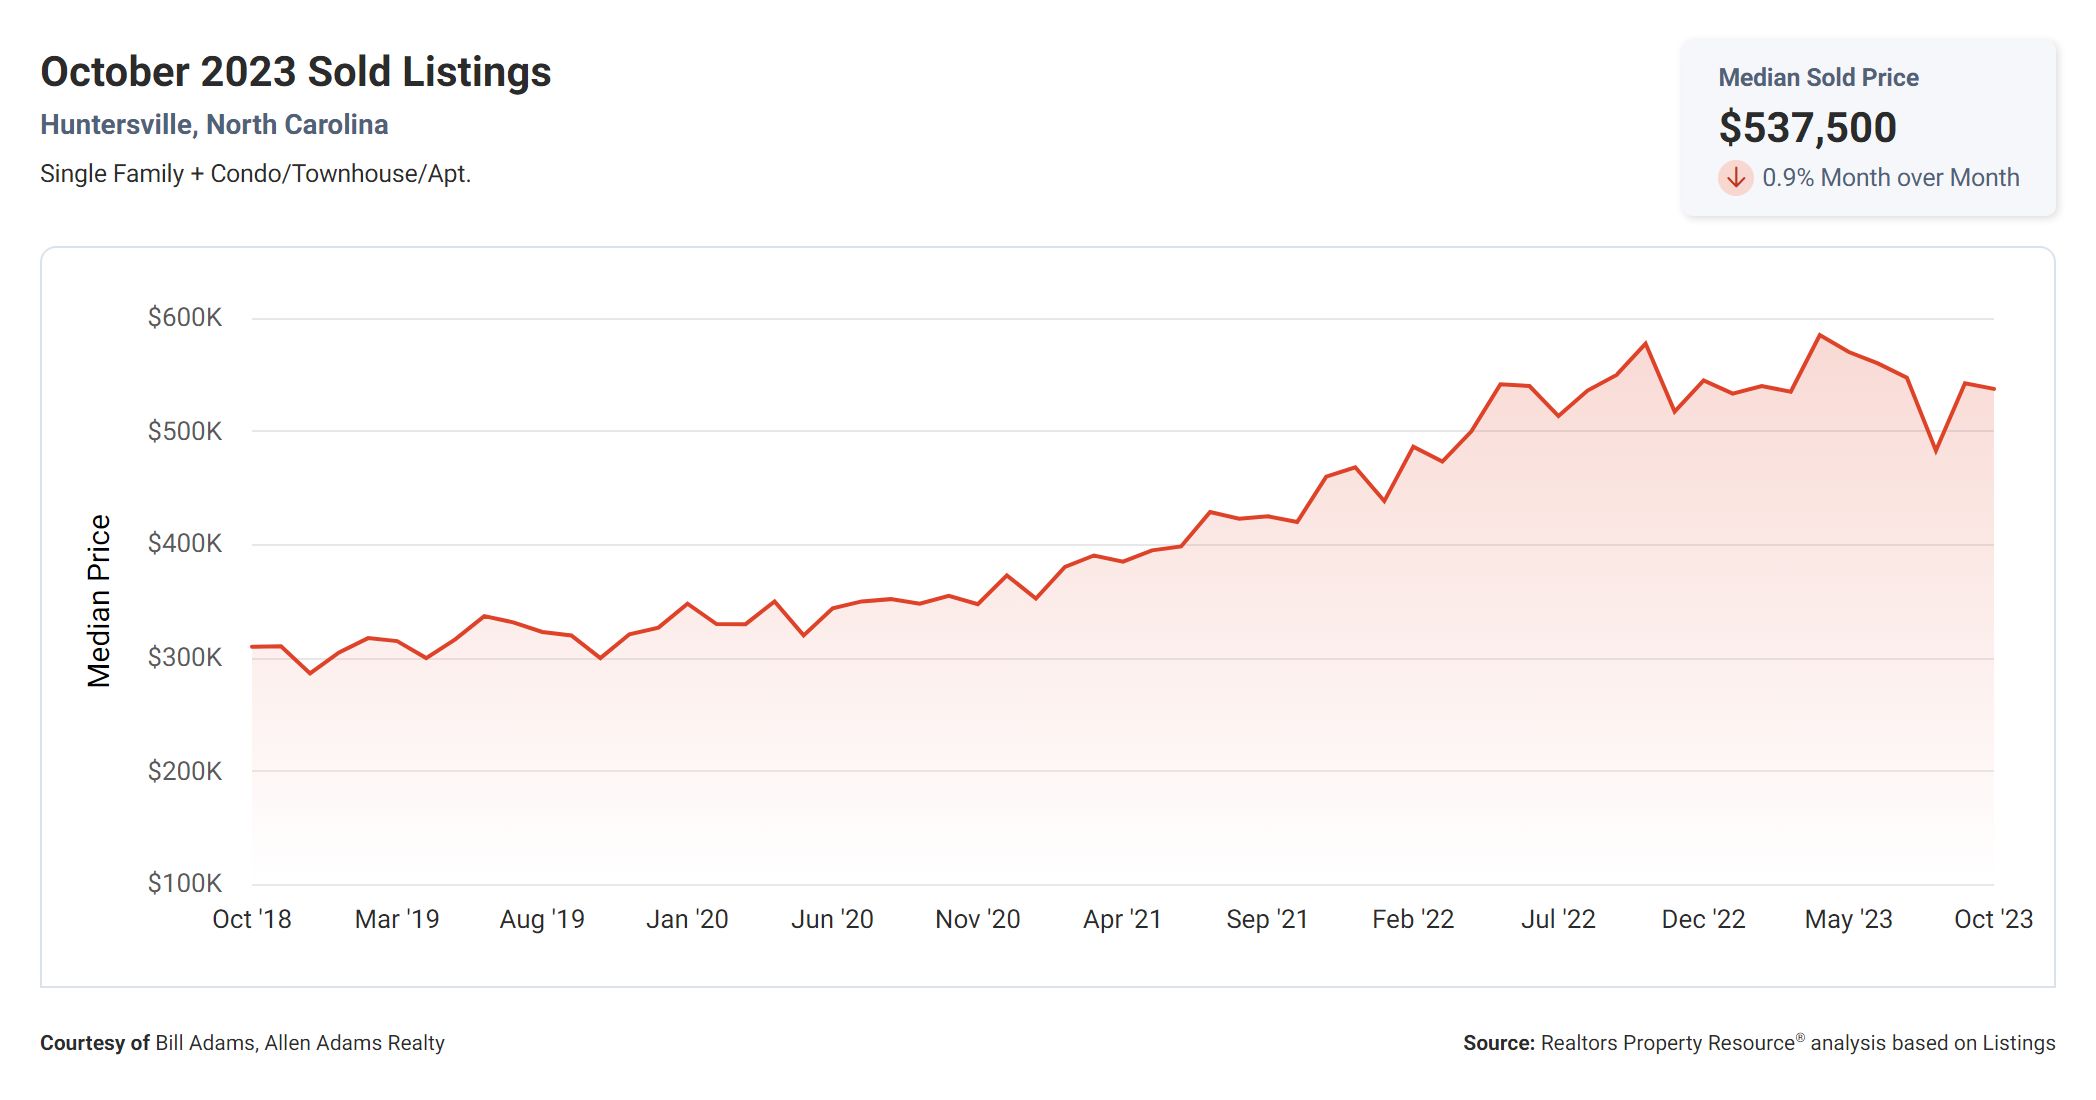
Finally, we have the “Median Sold Price,” which currently stands at $537,500. This metric represents the midpoint of all the sold prices in a given period. It provides a sense of the average price of homes that are selling. With a median sold price of $537,500, it indicates that the market is seeing a good number of higher-priced homes being sold. This could be attributed to various factors such as the desirability of the area, amenities, or the quality of properties available.
What The Numbers Mean
In summary, these real estate metrics paint a picture of a competitive market with limited inventory, where homes are selling relatively quickly and sellers are able to negotiate offers close to their asking price. However, there has been an increase in available inventory compared to the previous year, which may provide buyers with more options. The median sold price reflects a market with a good number of higher-priced homes being sold. As a buyer or seller, it is essential to consider these metrics when making decisions and to stay informed about the current state of the real estate market.
Ready To Make Huntersville, NC Your Home?
Huntersville, NC Homes For Sale

