Huntersville, NC Real Estate Trends For December 2023
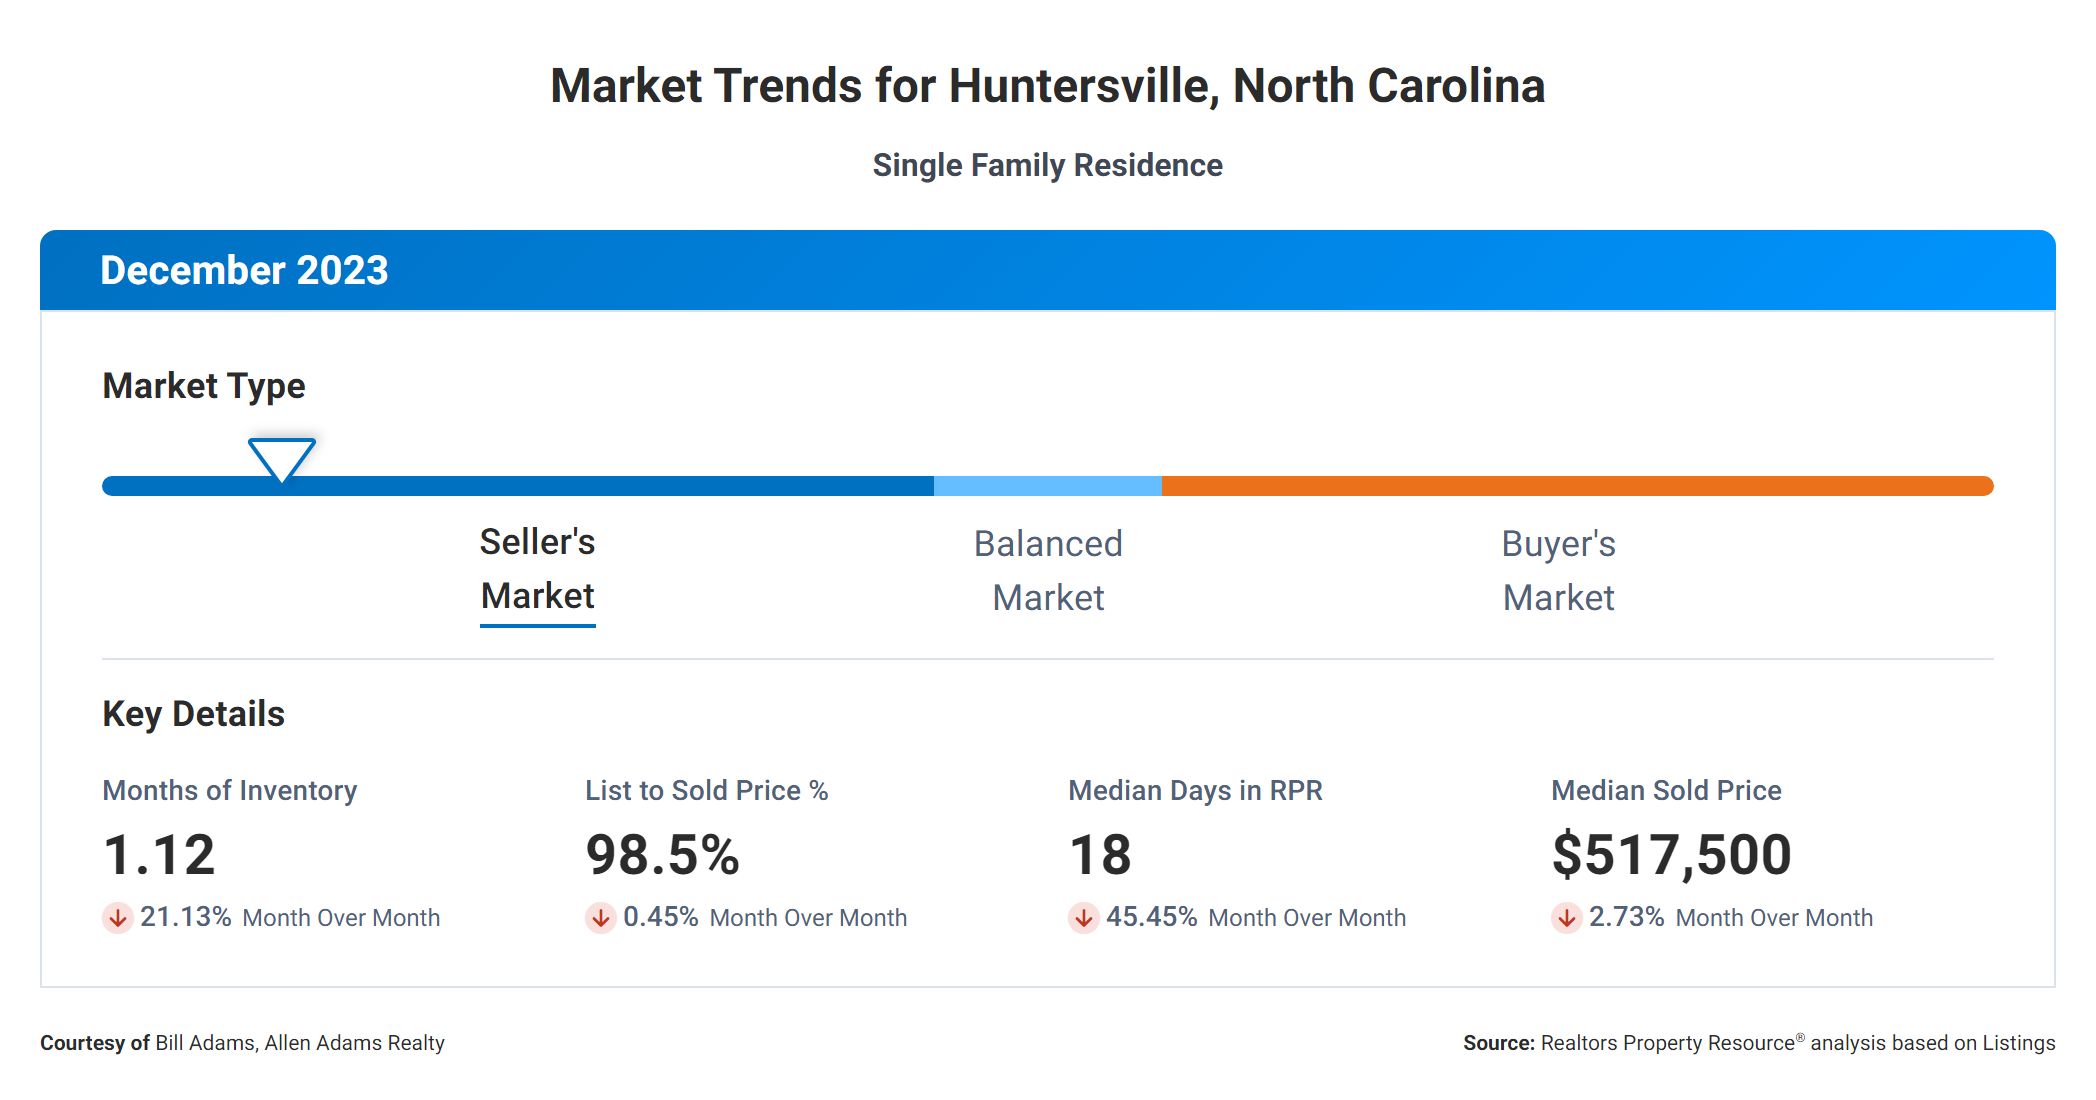
In the world of real estate, there are several key metrics that buyers and sellers should be aware of in order to make informed decisions. These metrics provide valuable insights into the current state of the market and can help gauge the level of activity and competitiveness. Let’s dive into the correlation between the following metrics: Months Supply of Inventory, 12-Month Change in Months of Inventory, Median Days Homes are On the Market, List to Sold Price Percentage, and Median Sold Price.
Months Supply
First, let’s take a look at the Months Supply of Inventory, which stands at 1.12. This metric represents the number of months it would take to sell all the current listings in a particular market if no new listings were added. A lower value indicates a tighter market with high demand and limited supply. In this case, a 1.12 months supply of inventory suggests a highly competitive market where properties may sell quickly.
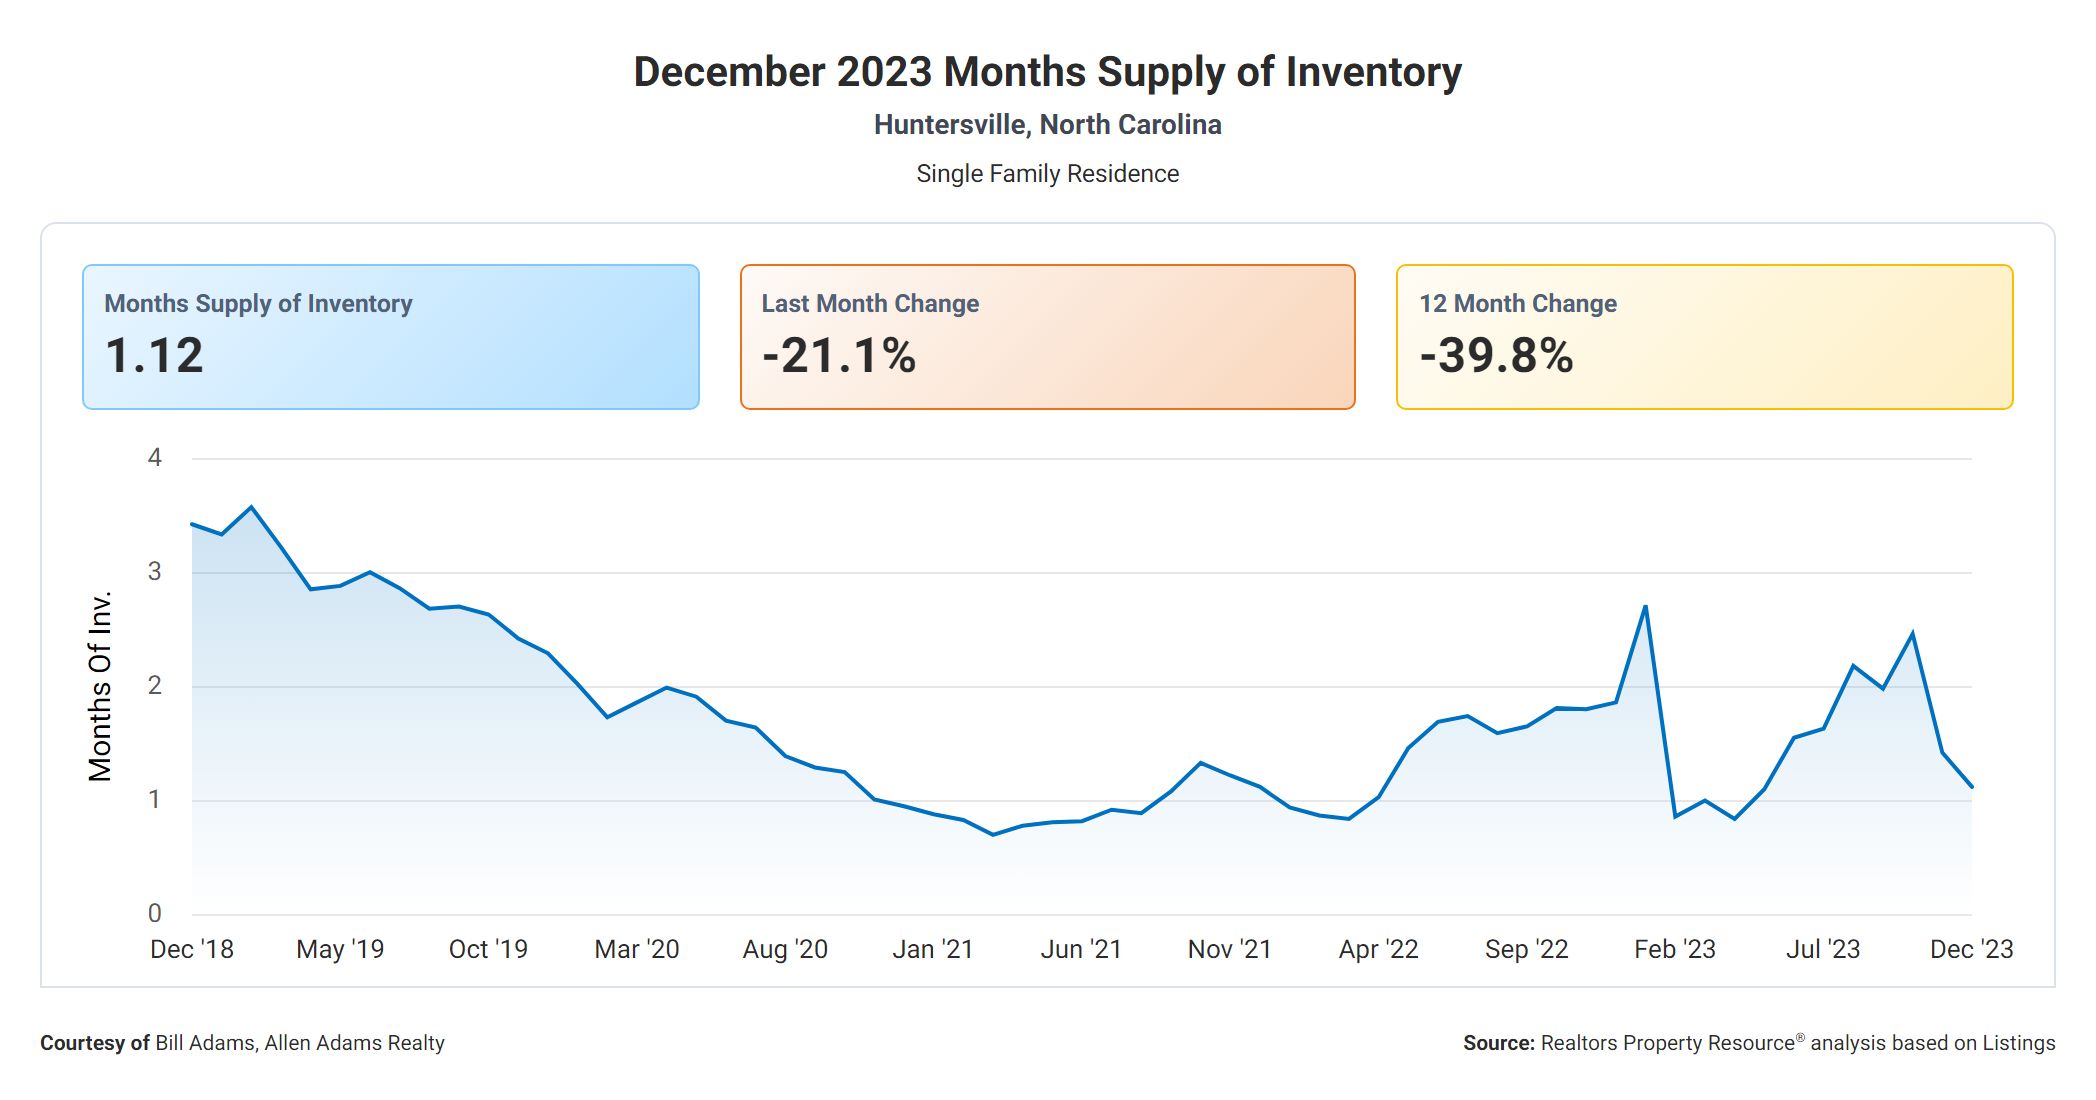
The 12-Month Change in Months of Inventory is another important metric to consider. It shows the percentage change in the supply of homes over the past year. In this instance, there has been a significant decrease of 39.78% in the number of months of inventory available. This indicates a market that has become even more competitive over the past year, with a shrinking supply relative to demand.
Days On Market
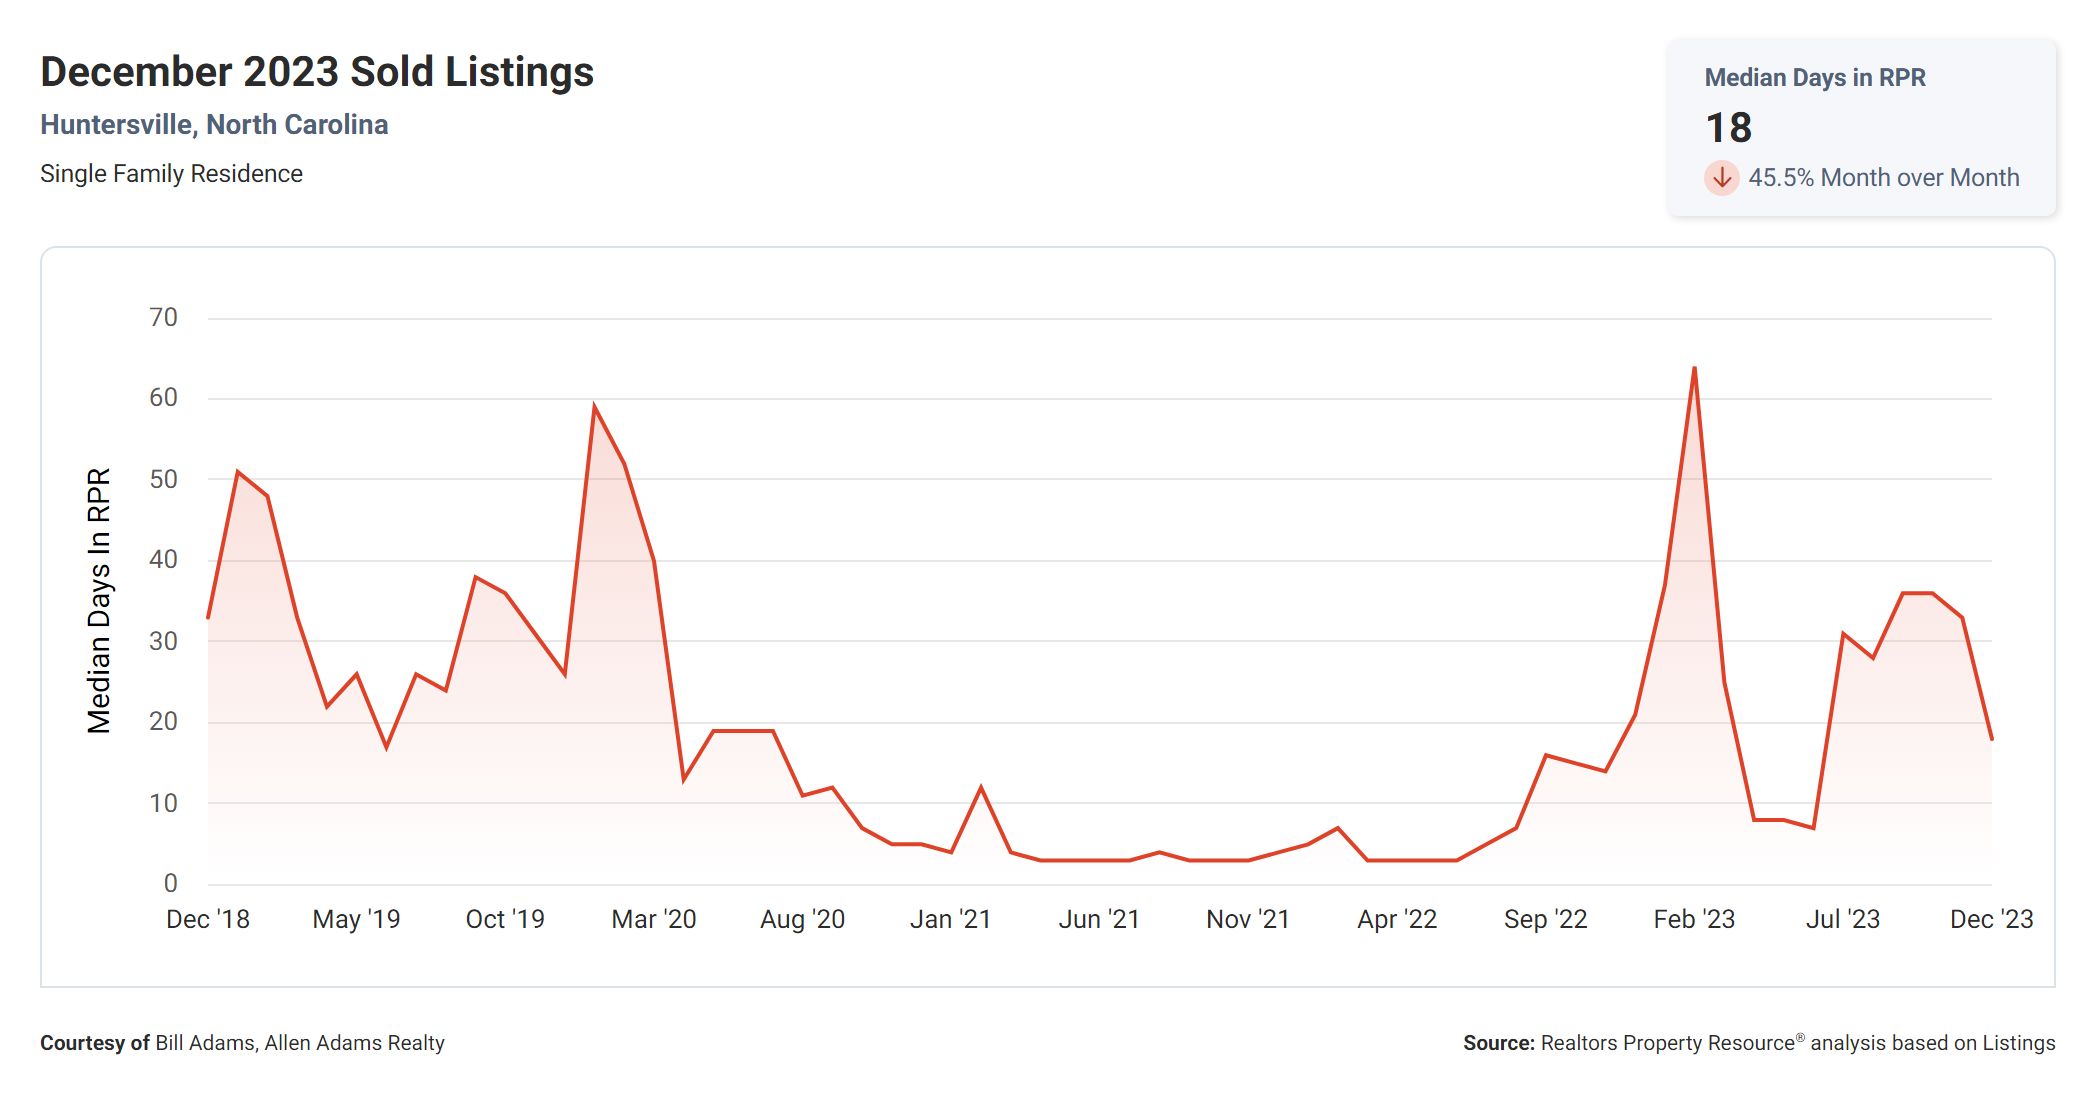
Next, we have the Median Days Homes are On the Market, which stands at 18. This metric gives an idea of how long it takes, on average, for a property to sell. With a relatively low median of 18 days, it suggests that homes are selling quickly in this market. This could be attributed to high demand, limited supply, and possibly attractive pricing.
Sale Price Versus List Price
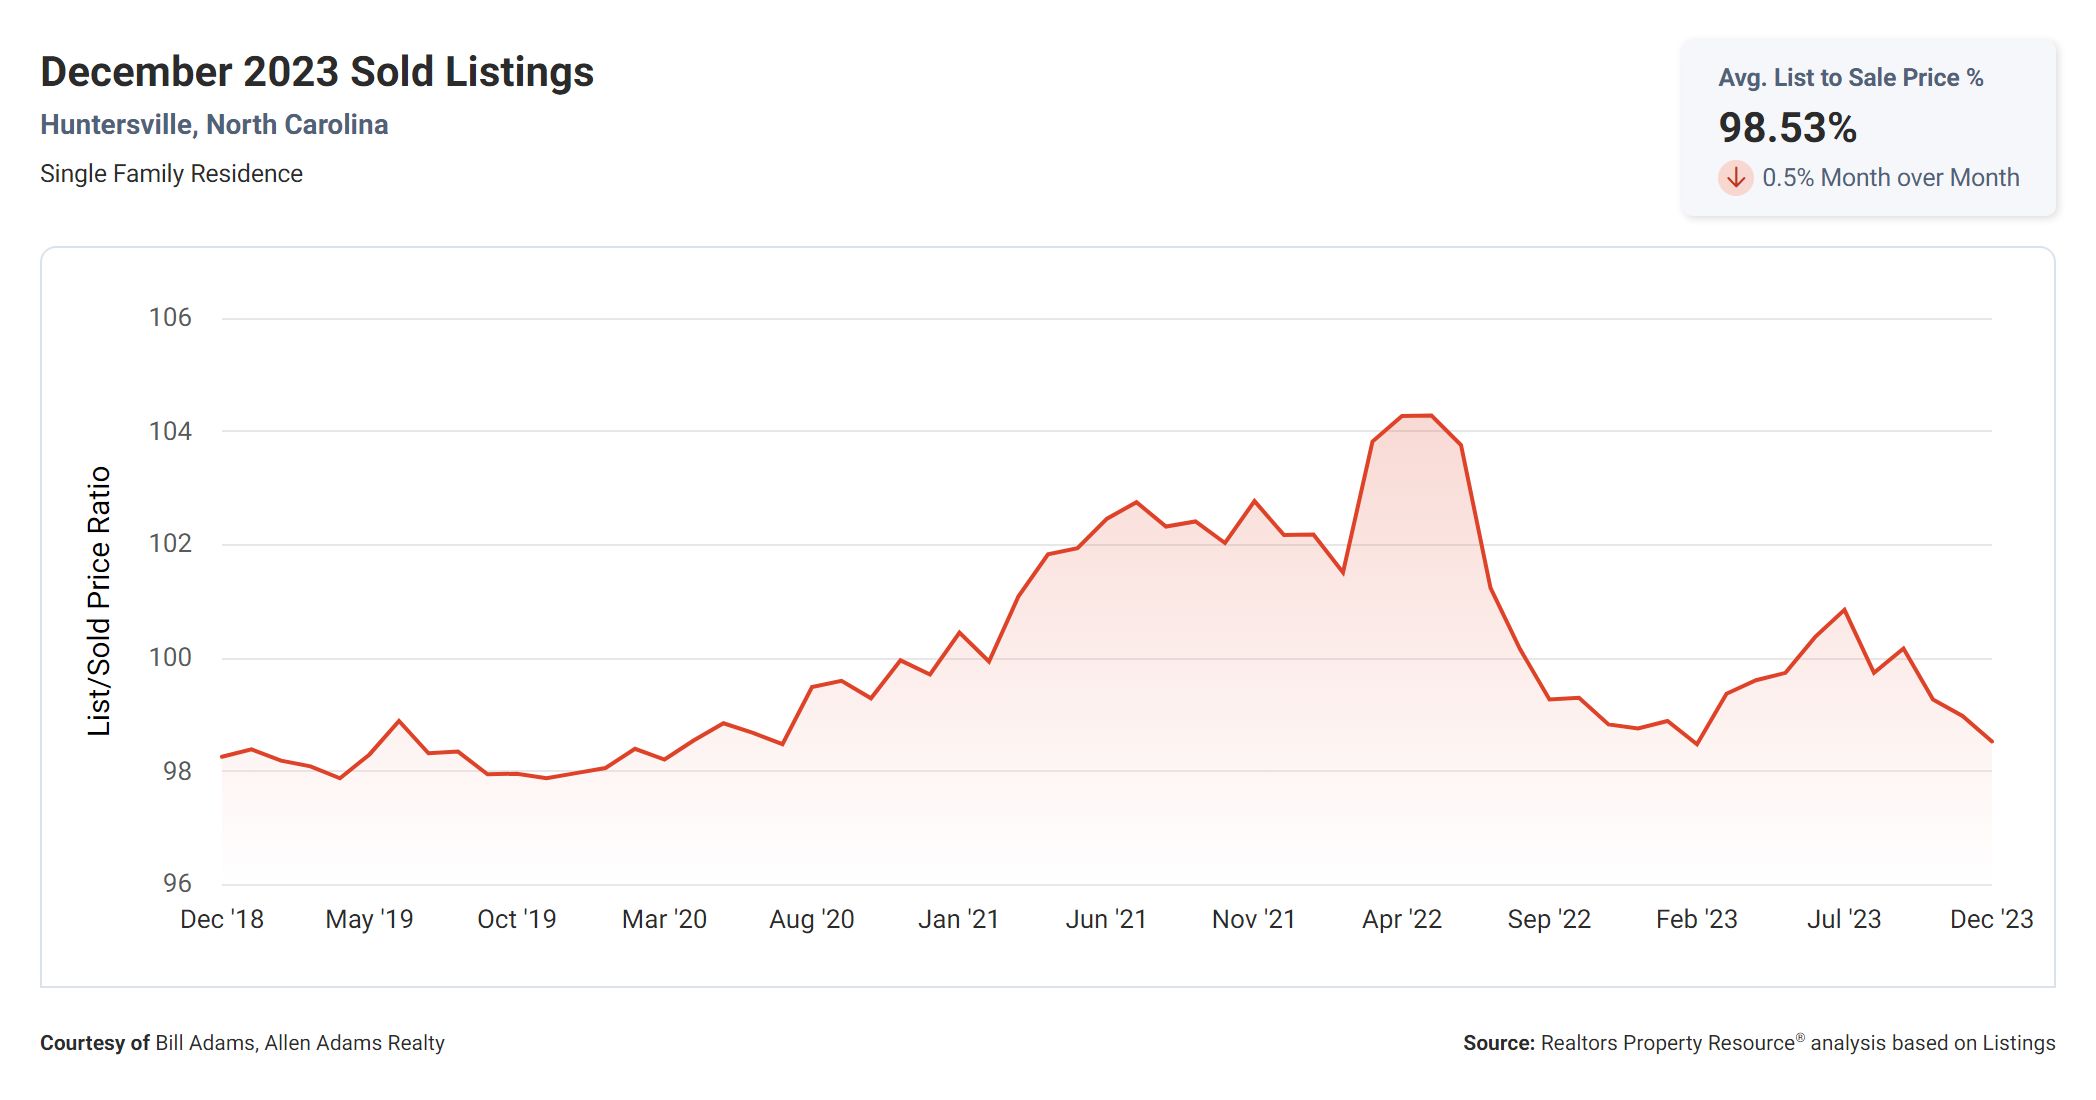
Moving on to the List to Sold Price Percentage, which is at 98.5%. This metric represents the ratio of the final sold price of a home to its original listing price. A higher percentage indicates that homes are selling closer to their initial list price, which is often seen in a competitive market. The 98.5% figure suggests that sellers are achieving close to their desired price, further indicating a strong market.
Median Sold Price
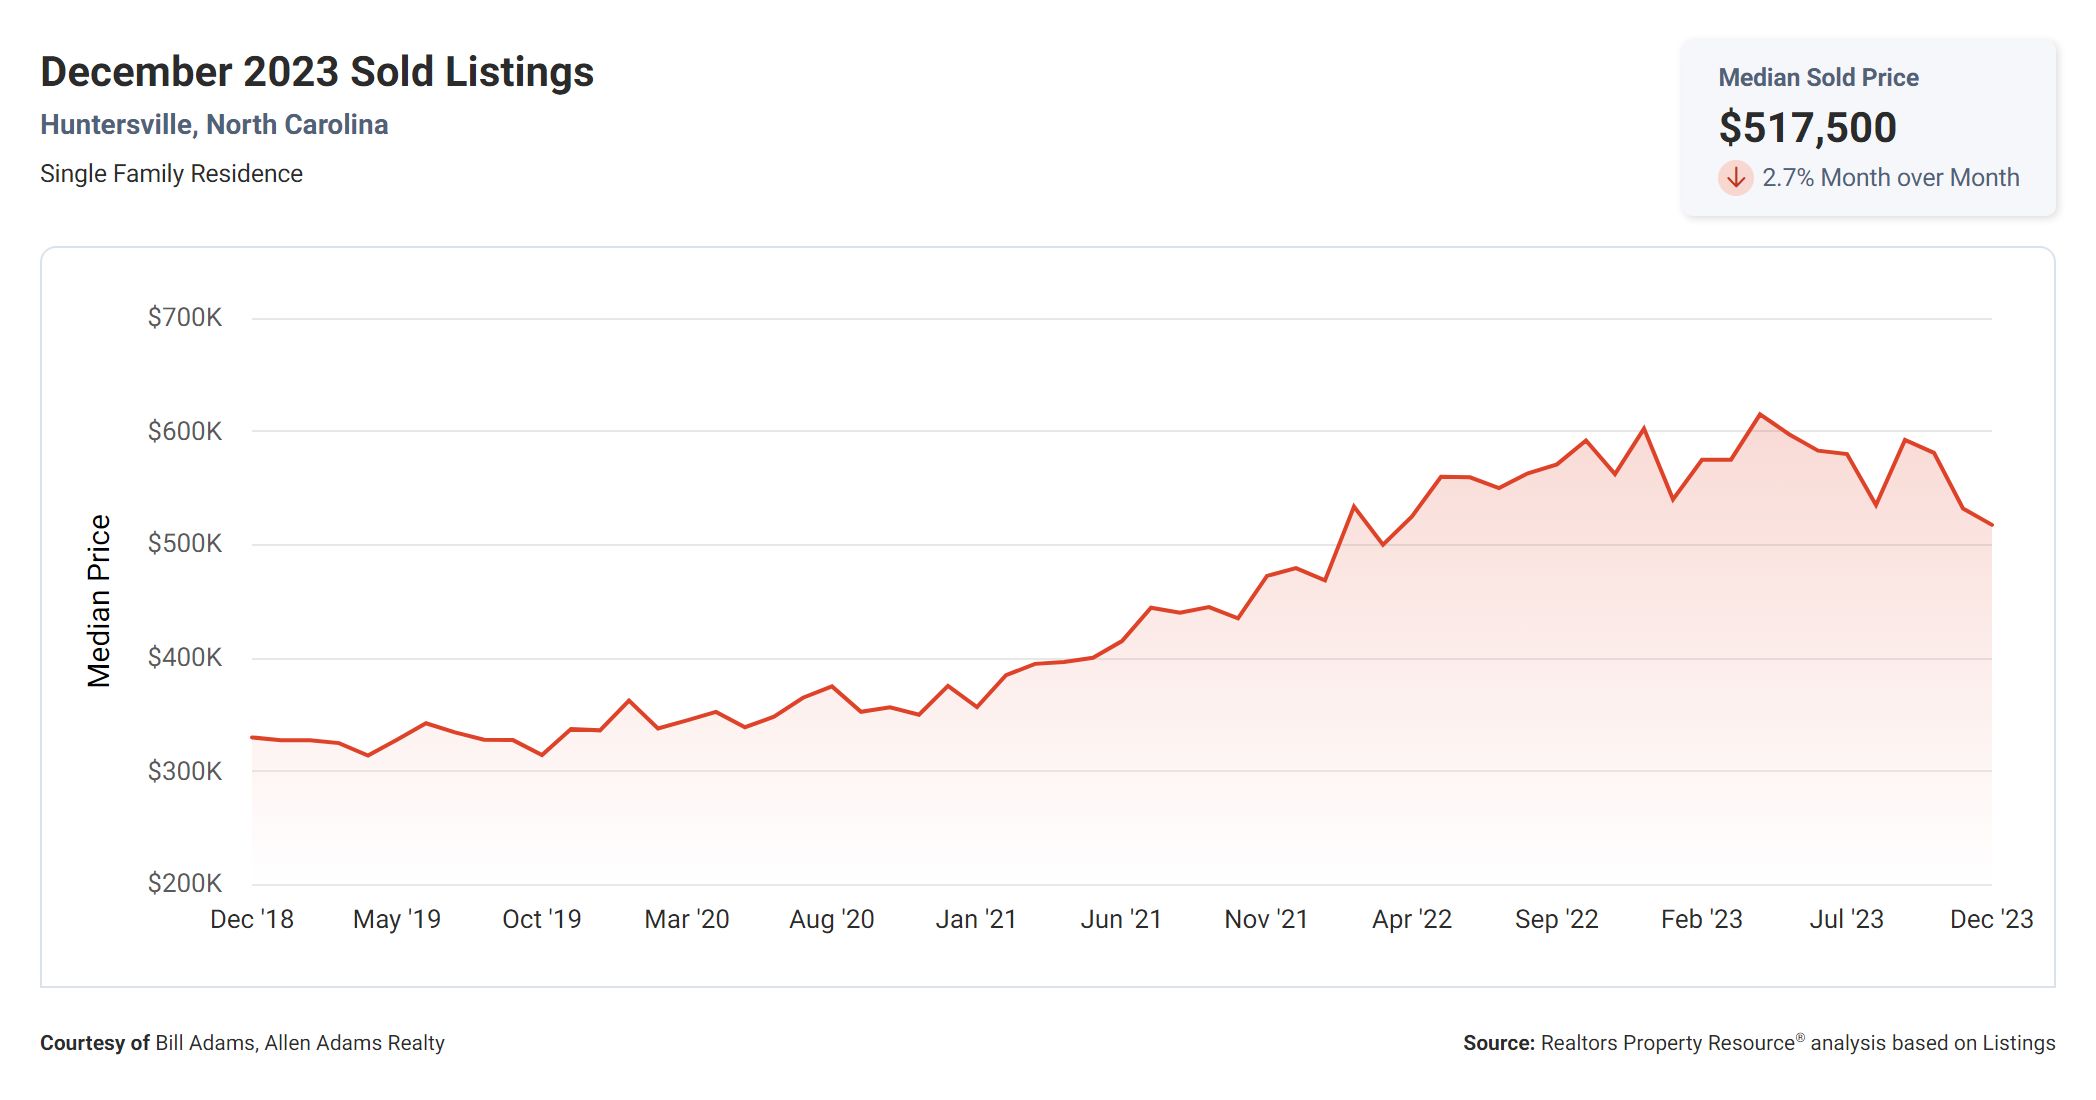
Finally, let’s consider the Median Sold Price, which is $517,500. This metric represents the middle value of all the sold prices in a given area. It provides an indication of the overall price range and trends in the market. With a median sold price of $517,500, it suggests that properties in this market are at a relatively higher price point.
What The Numbers Mean
When we examine these metrics together, we can see a clear correlation. The low Months Supply of Inventory and the significant decrease in the 12-Month Change in Months of Inventory highlight a highly competitive market with limited supply. This is further supported by the low Median Days Homes are On the Market, indicating quick sales. The List to Sold Price Percentage of 98.5% suggests that sellers are achieving their desired prices, and the Median Sold Price of $517,500 indicates a market with higher-priced properties.
Conclusion
For buyers, it’s important to be prepared for a competitive market and act swiftly when a desirable property becomes available. Sellers can take advantage of the high demand and limited supply by pricing their homes strategically to maximize their potential sale price.
Ready To Make Huntersville, NC Your Home?
View Huntersville, NC Homes For Sale

