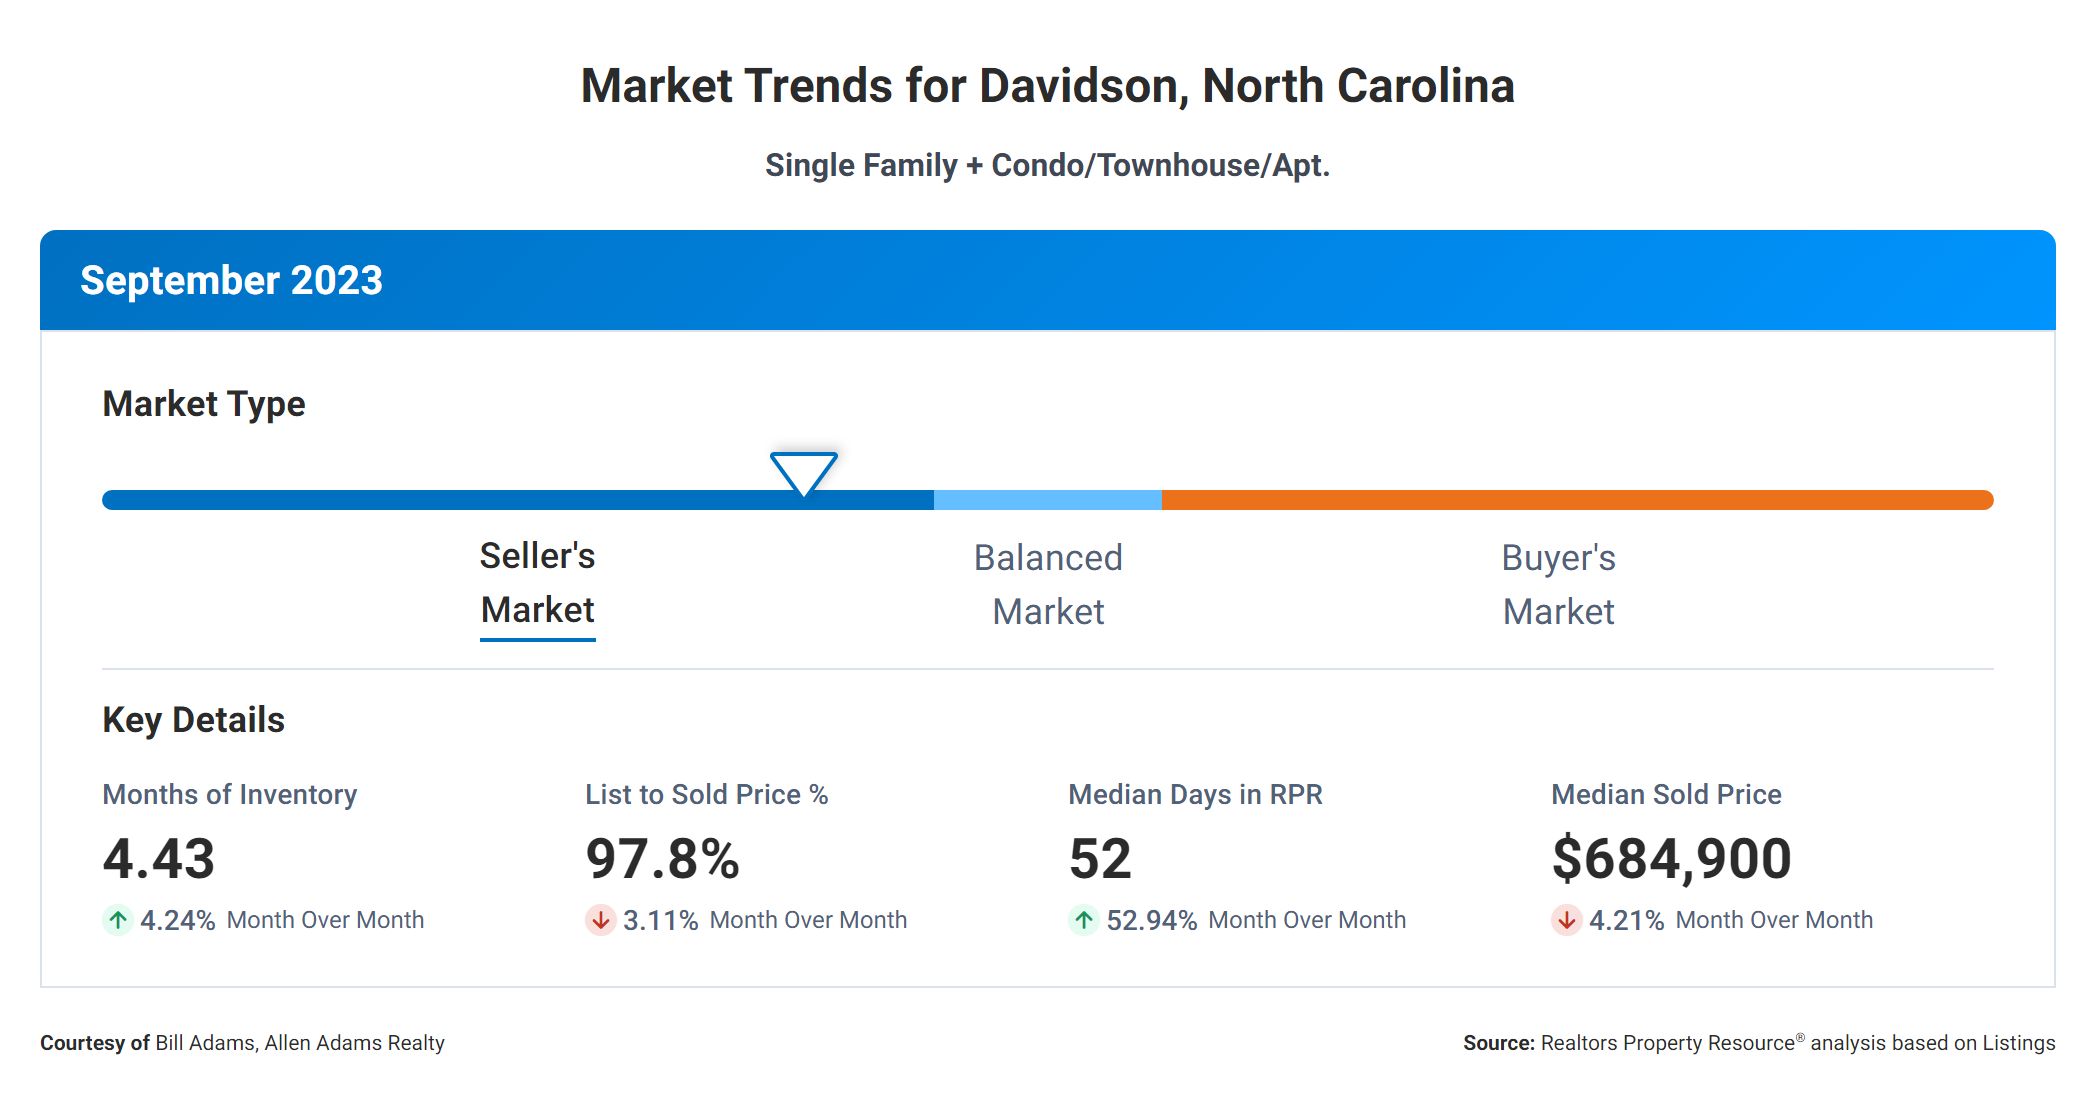
Today we will be exploring the correlation between several key real estate metrics that are of utmost importance to both buyers and sellers in the market. By analyzing this data, we aim to provide you with valuable insights into the current state of the Davidson, NC real estate market and empower you to make informed decisions.
Months Supply
Let’s start by examining the “Months Supply of Inventory,” which currently stands at 4.43. This metric represents the number of months it would take to sell all available homes on the market if no new listings were to come on. A lower supply of inventory indicates a seller’s market, where demand exceeds supply, leading to potentially higher prices.
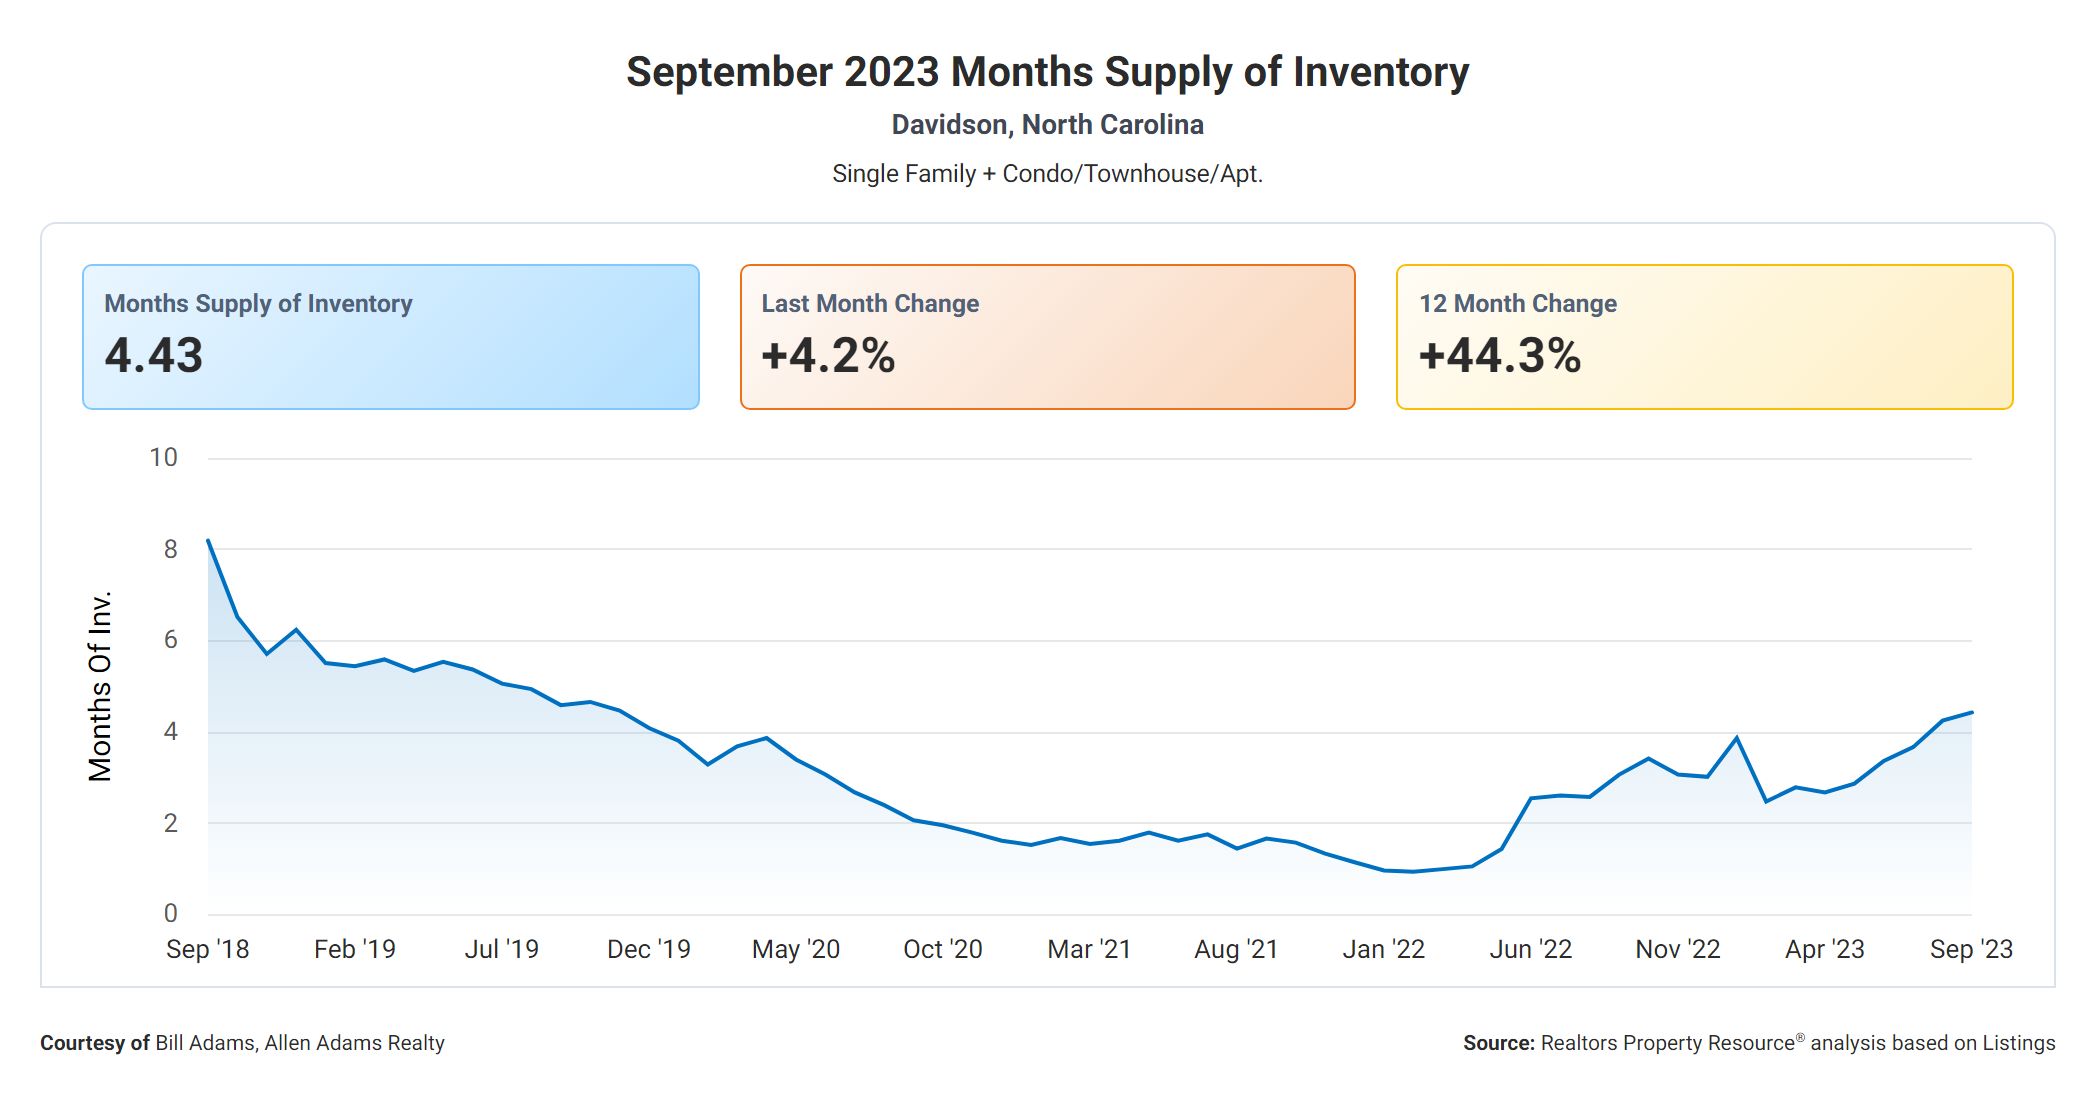
Now, let’s shift our attention to the “12-Month Change in Months of Inventory,” which shows an increase of +44.3%. This signifies a significant shift in the market dynamics over the past year, with the supply of homes increasing at a relatively faster pace compared to the demand. This shift could potentially result in a more balanced market or even a buyer’s market, where buyers have more negotiating power.
Days On Market
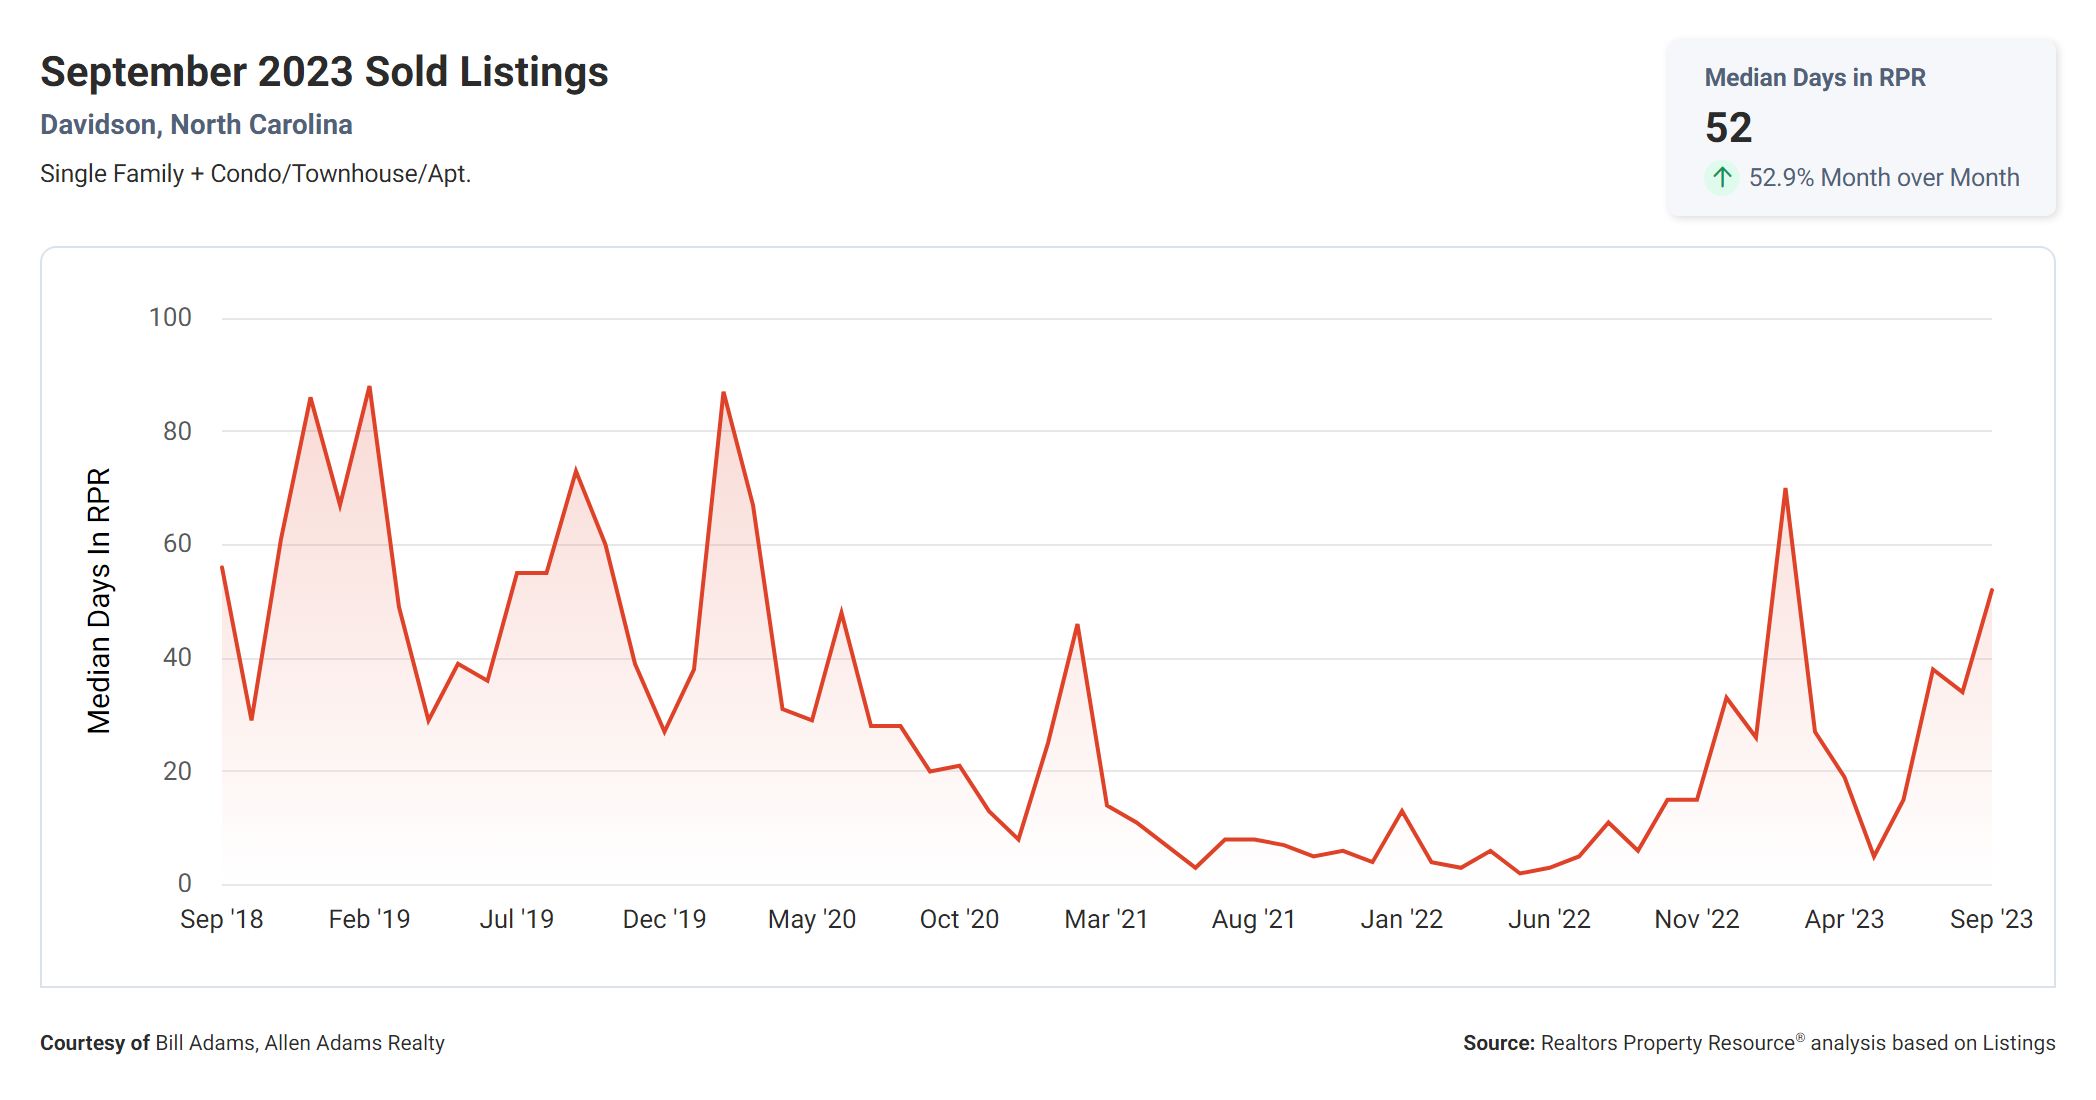
Moving on, we come to the “Median Days Homes are On the Market,” which currently stands at 52. This metric indicates the average number of days it takes for a home to sell once it is listed. A shorter time on the market suggests a higher demand for properties, which can lead to quicker sales and potentially multiple offers from interested buyers.
Sale Price Versus List Price
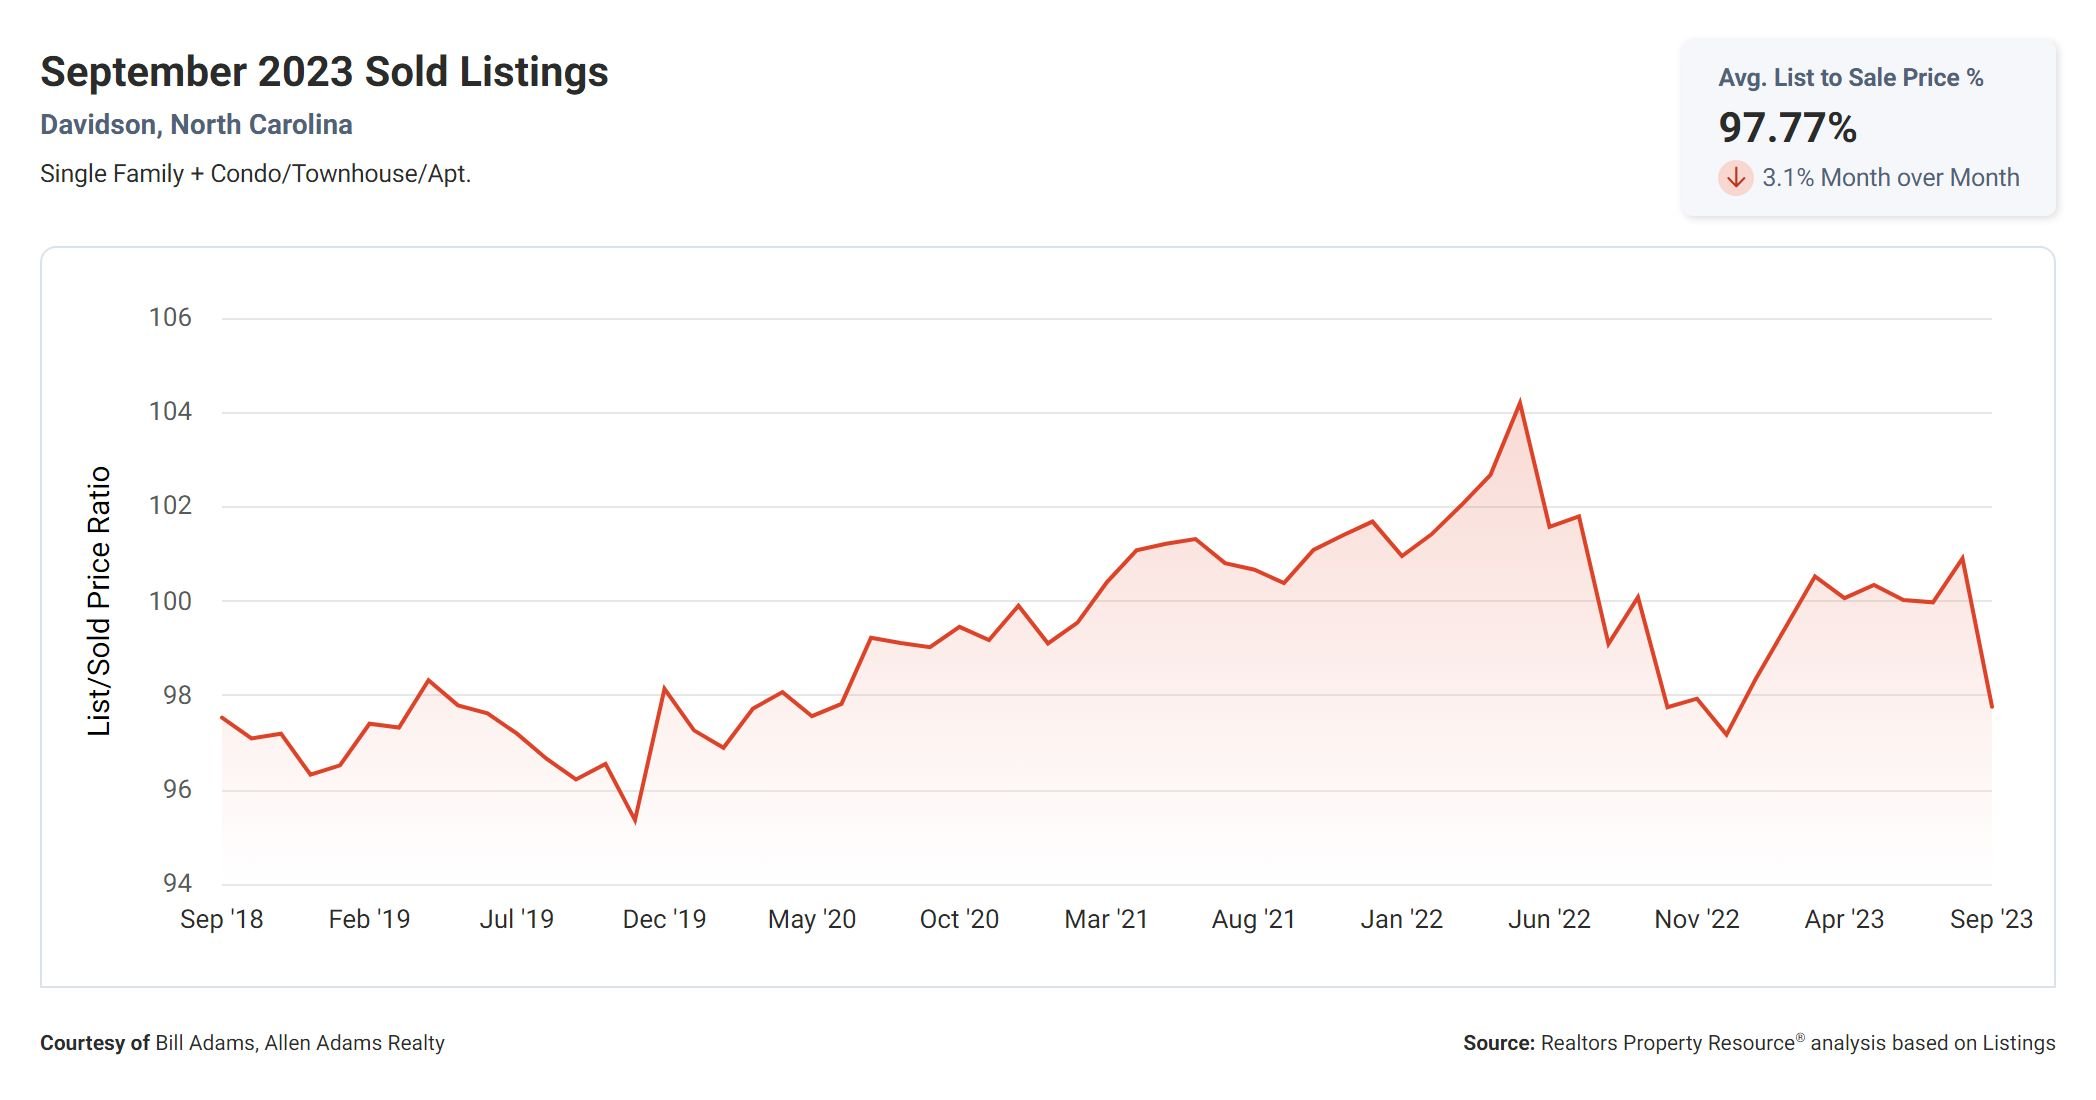
Next, we have the “List to Sold Price Percentage,” which currently stands at 97.8%. This metric demonstrates the percentage at which a home’s final sale price compares to its original listing price. A higher percentage suggests that sellers are receiving offers close to their asking price, indicating a competitive market and potentially higher property values.
Median Sold Price
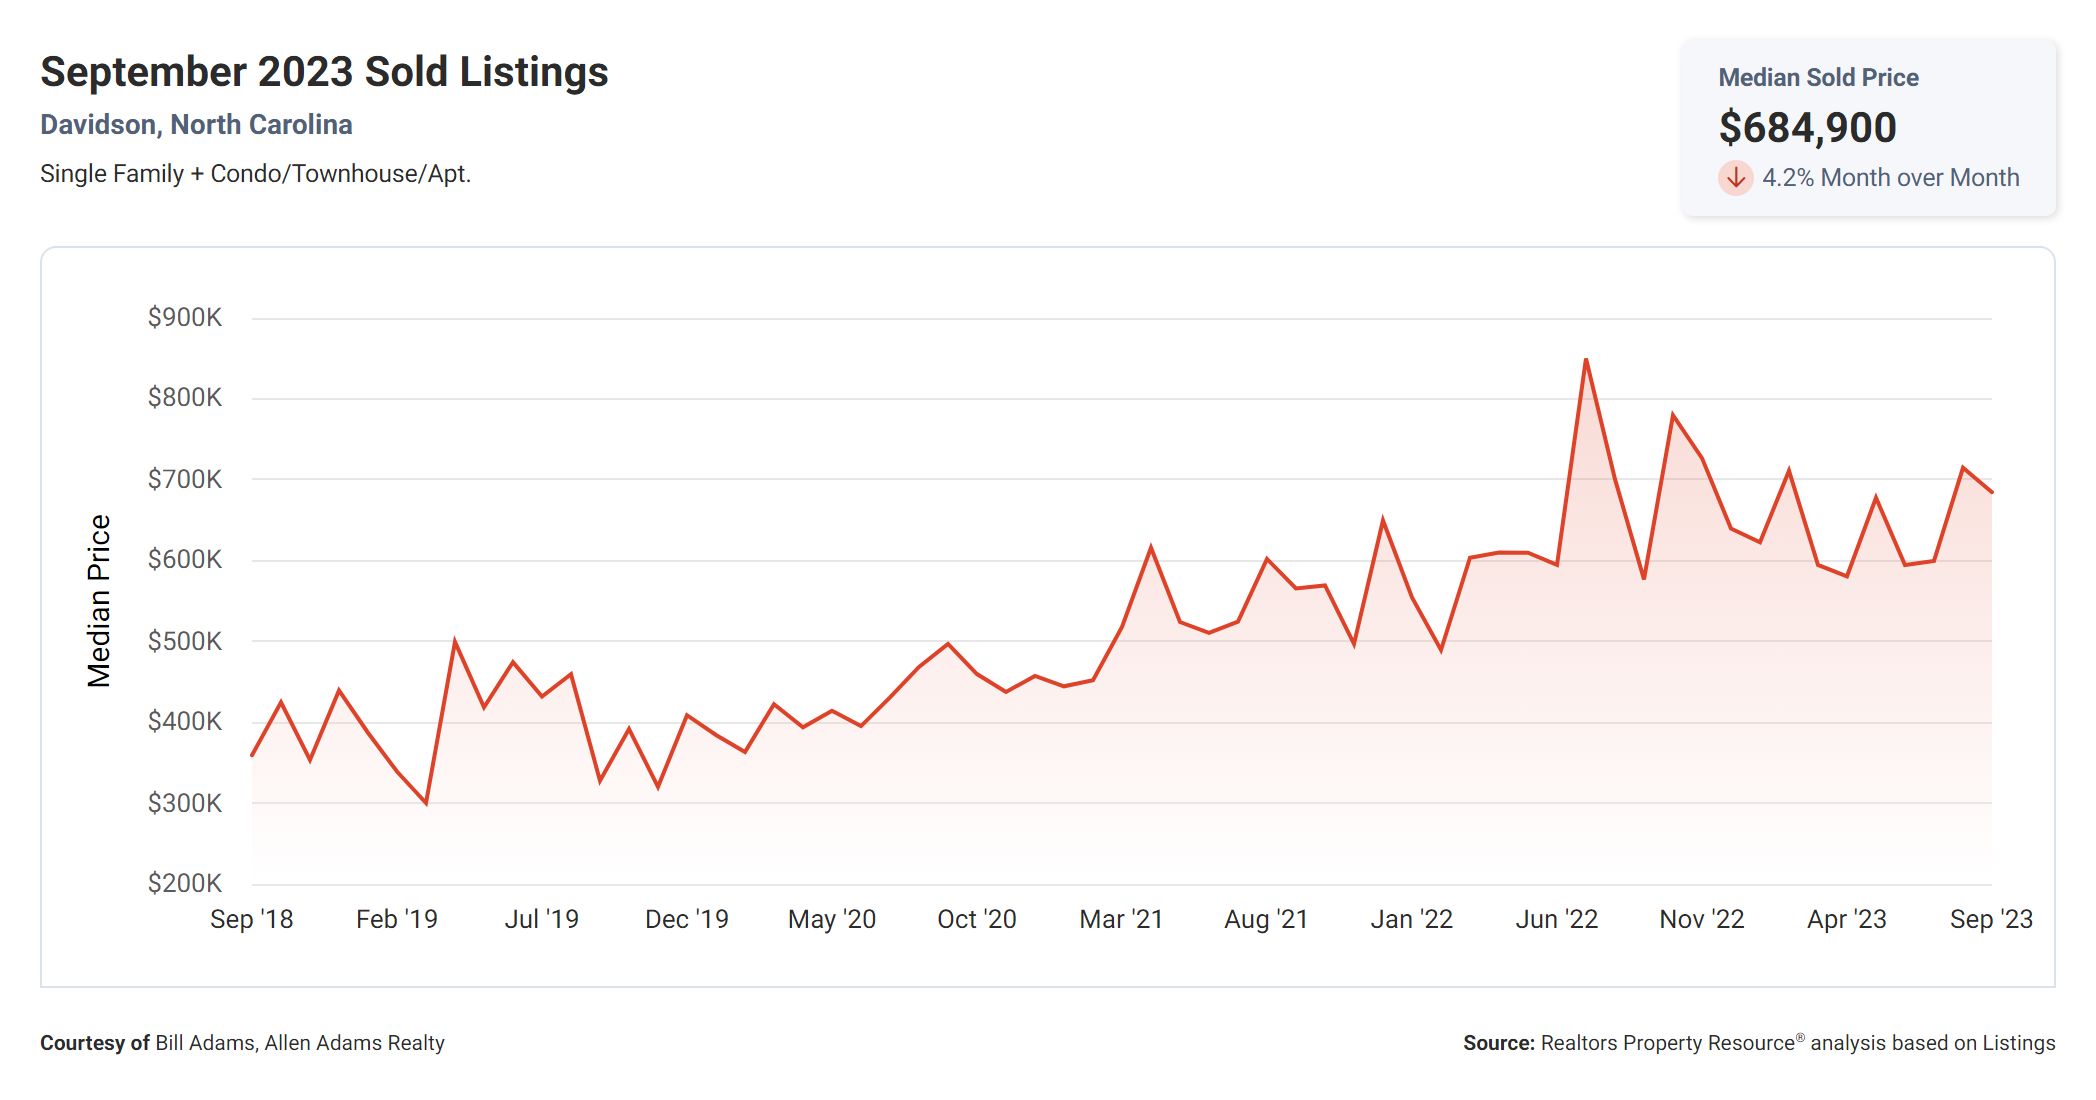
Finally, we arrive at the “Median Sold Price,” which currently sits at $684,900. This metric represents the middle point of all the sold prices in a given area, providing an insight into the overall price range of homes in the market. A higher median sold price suggests a more affluent market, whereas a lower figure may indicate more affordable options for buyers.
What The Numbers Mean
Now, let’s connect the dots between these metrics. The increase in the “12-Month Change in Months of Inventory” indicates a potential shift towards a buyer’s market, which is further supported by the relatively high “Months Supply of Inventory.” This shift could potentially result in homes spending more time on the market, as indicated by the “Median Days Homes are On the Market.”
However, despite these market dynamics, the “List to Sold Price Percentage” remains relatively high at 97.8%, suggesting that sellers are still receiving offers close to their asking price. This implies that while buyers may have more options to choose from, they still need to remain competitive in their offers.
Lastly, the “Median Sold Price” of $684,900 indicates that the market is currently catering to buyers and sellers in the mid to higher price ranges, making it important for both parties to carefully consider their pricing strategies.
Conclusion
In conclusion, these real estate metrics provide valuable insights into the current state of the market. Buyers may find themselves in a market where they have more options to choose from, potentially leading to longer negotiation periods. On the other hand, sellers can still expect to receive offers close to their asking price, given the high “List to Sold Price Percentage.” As always, it is crucial for both buyers and sellers to work with experienced real estate professionals who can navigate the market and guide them towards achieving their goals.
If you would like to see Davidson listings of homes for sale or learn more about the area click here.

