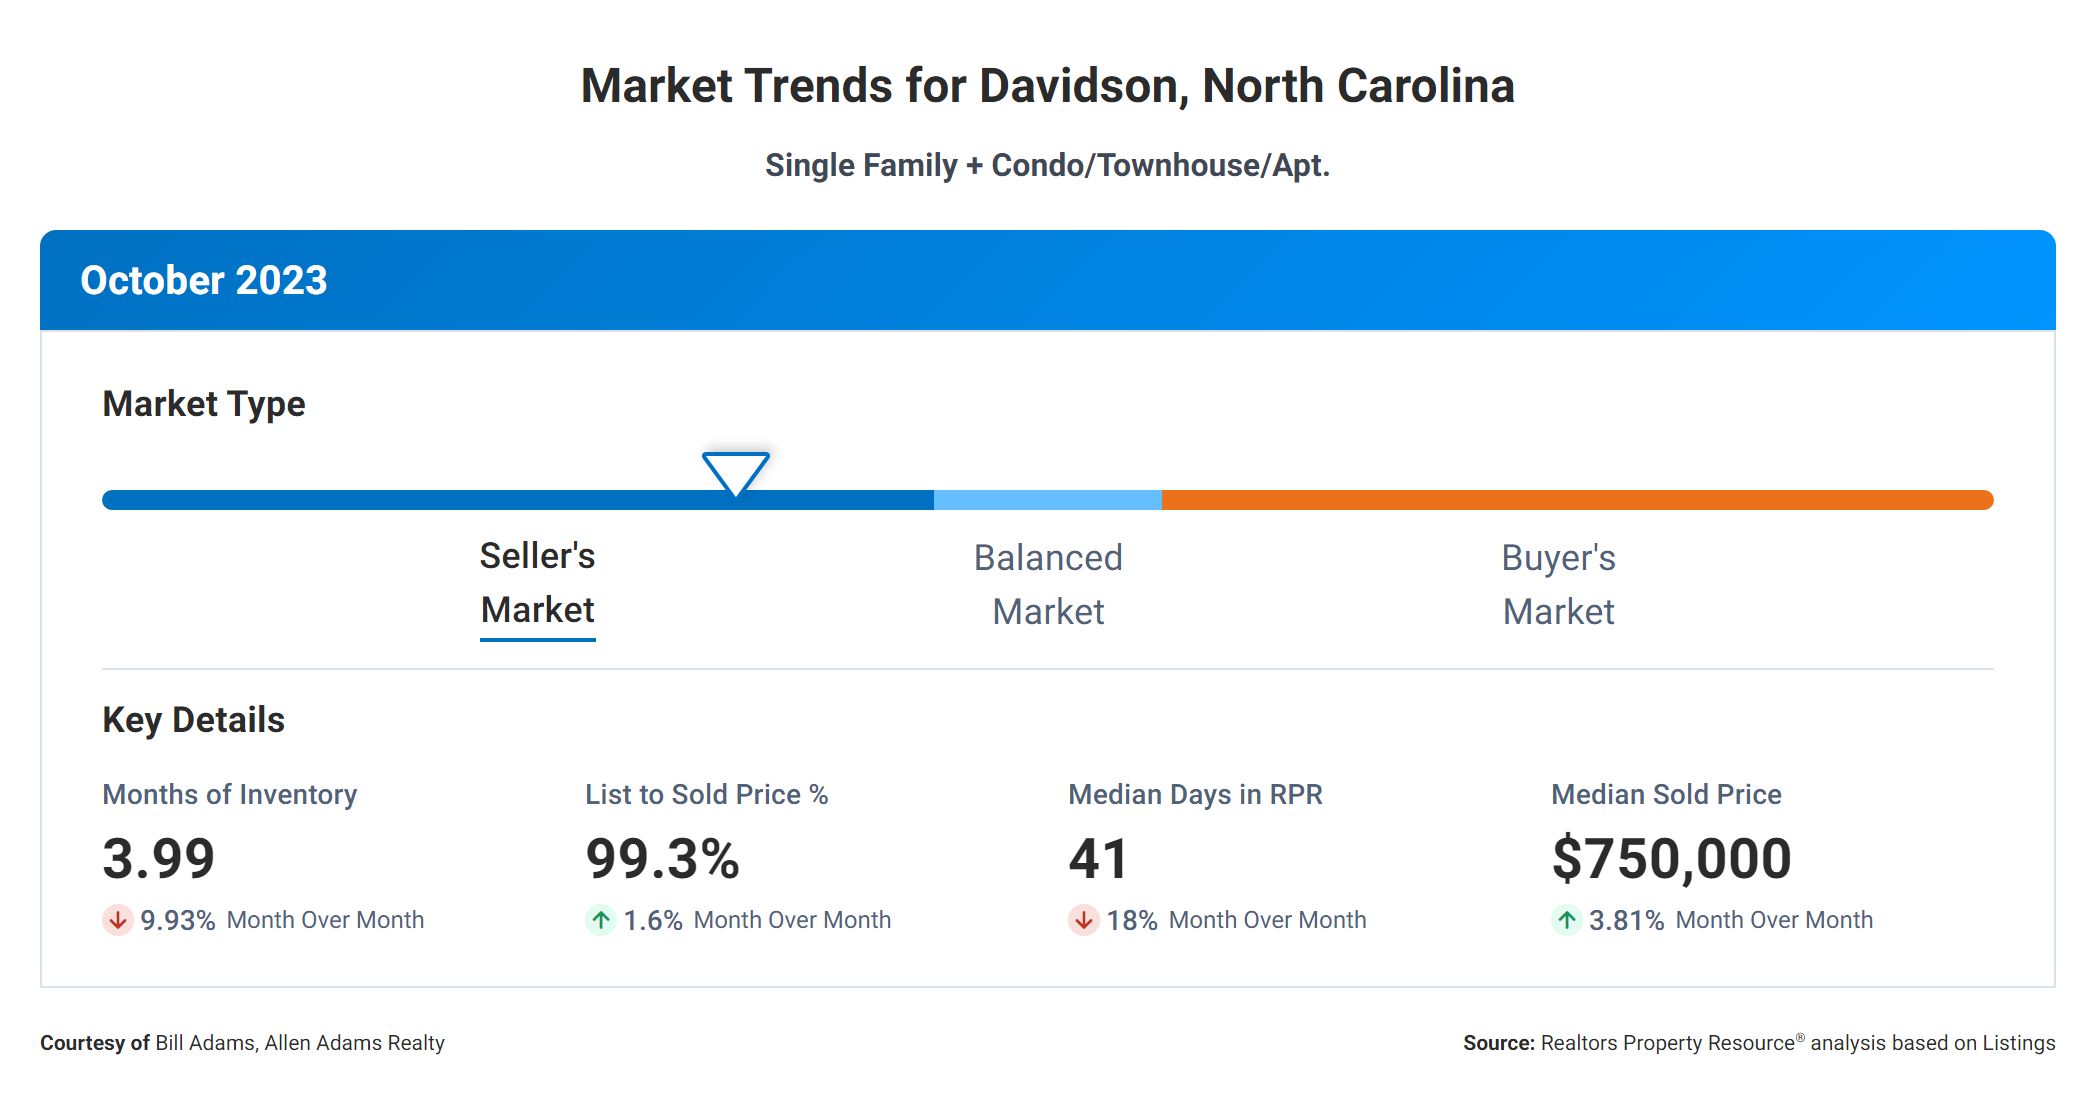
When it comes to Davidson, NC real estate, there are several important metrics that both buyers and sellers should be aware of. These metrics can provide valuable insight into the current state of the market and help guide decisions related to buying or selling a property. Let’s take a closer look at the correlation between some key real estate metrics.
Months Supply
First, let’s consider the Months Supply of Inventory, which currently stands at 3.99. This metric measures the number of months it would take to sell all the available homes on the market if no new listings were added. A lower value indicates a seller’s market, where demand exceeds supply, while a higher value suggests a buyer’s market, where supply exceeds demand. In this case, a Months Supply of Inventory of 3.99 suggests a balanced market, with a relatively equal balance between buyers and sellers.
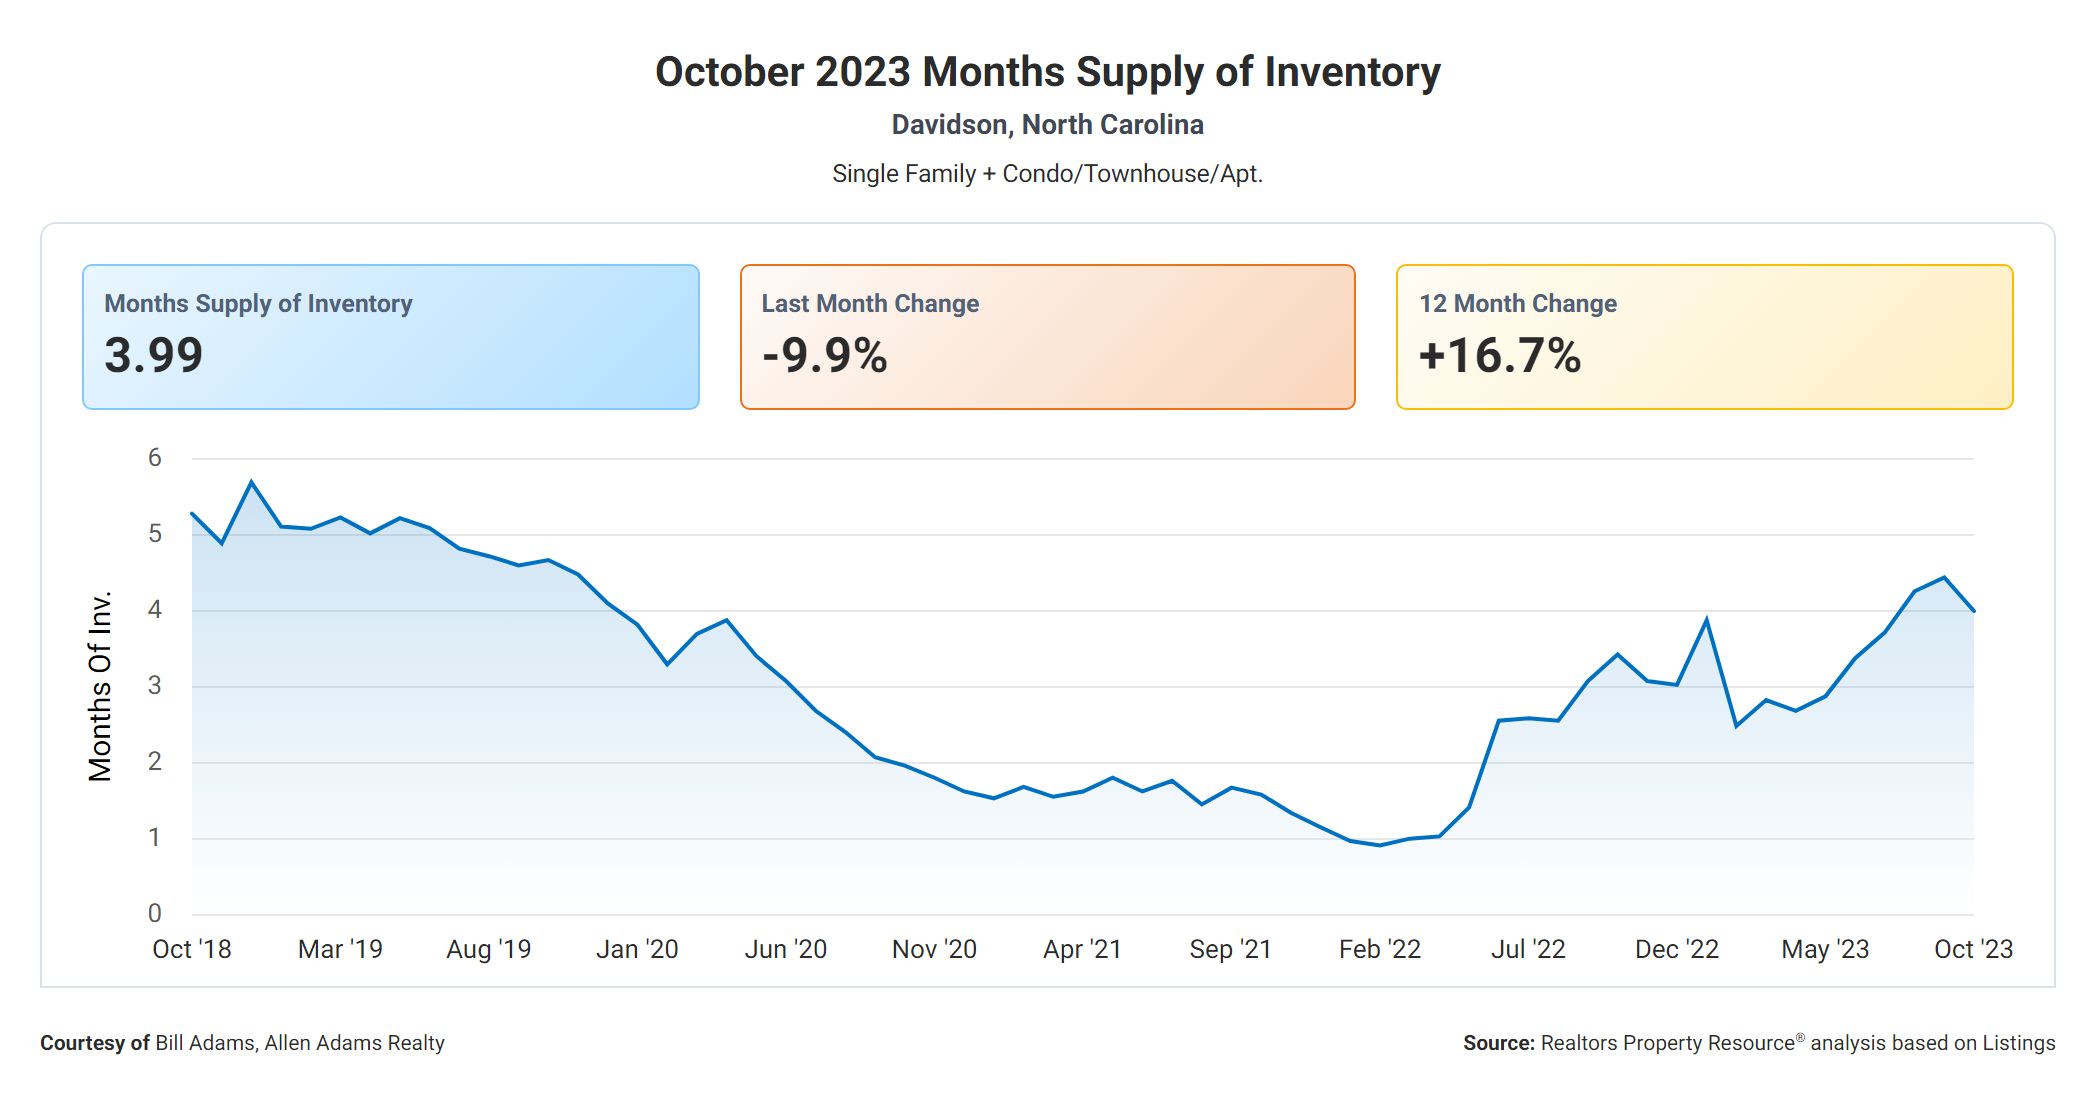
Next, let’s examine the 12-Month Change in Months of Inventory, which is +16.67%. This metric tracks the percentage change in the Months Supply of Inventory compared to the previous year. A positive value indicates an increase in supply relative to demand, while a negative value suggests the opposite. In this instance, the +16.67% change suggests that there has been an increase in inventory over the past year, potentially giving buyers more options to choose from.
Days On Market
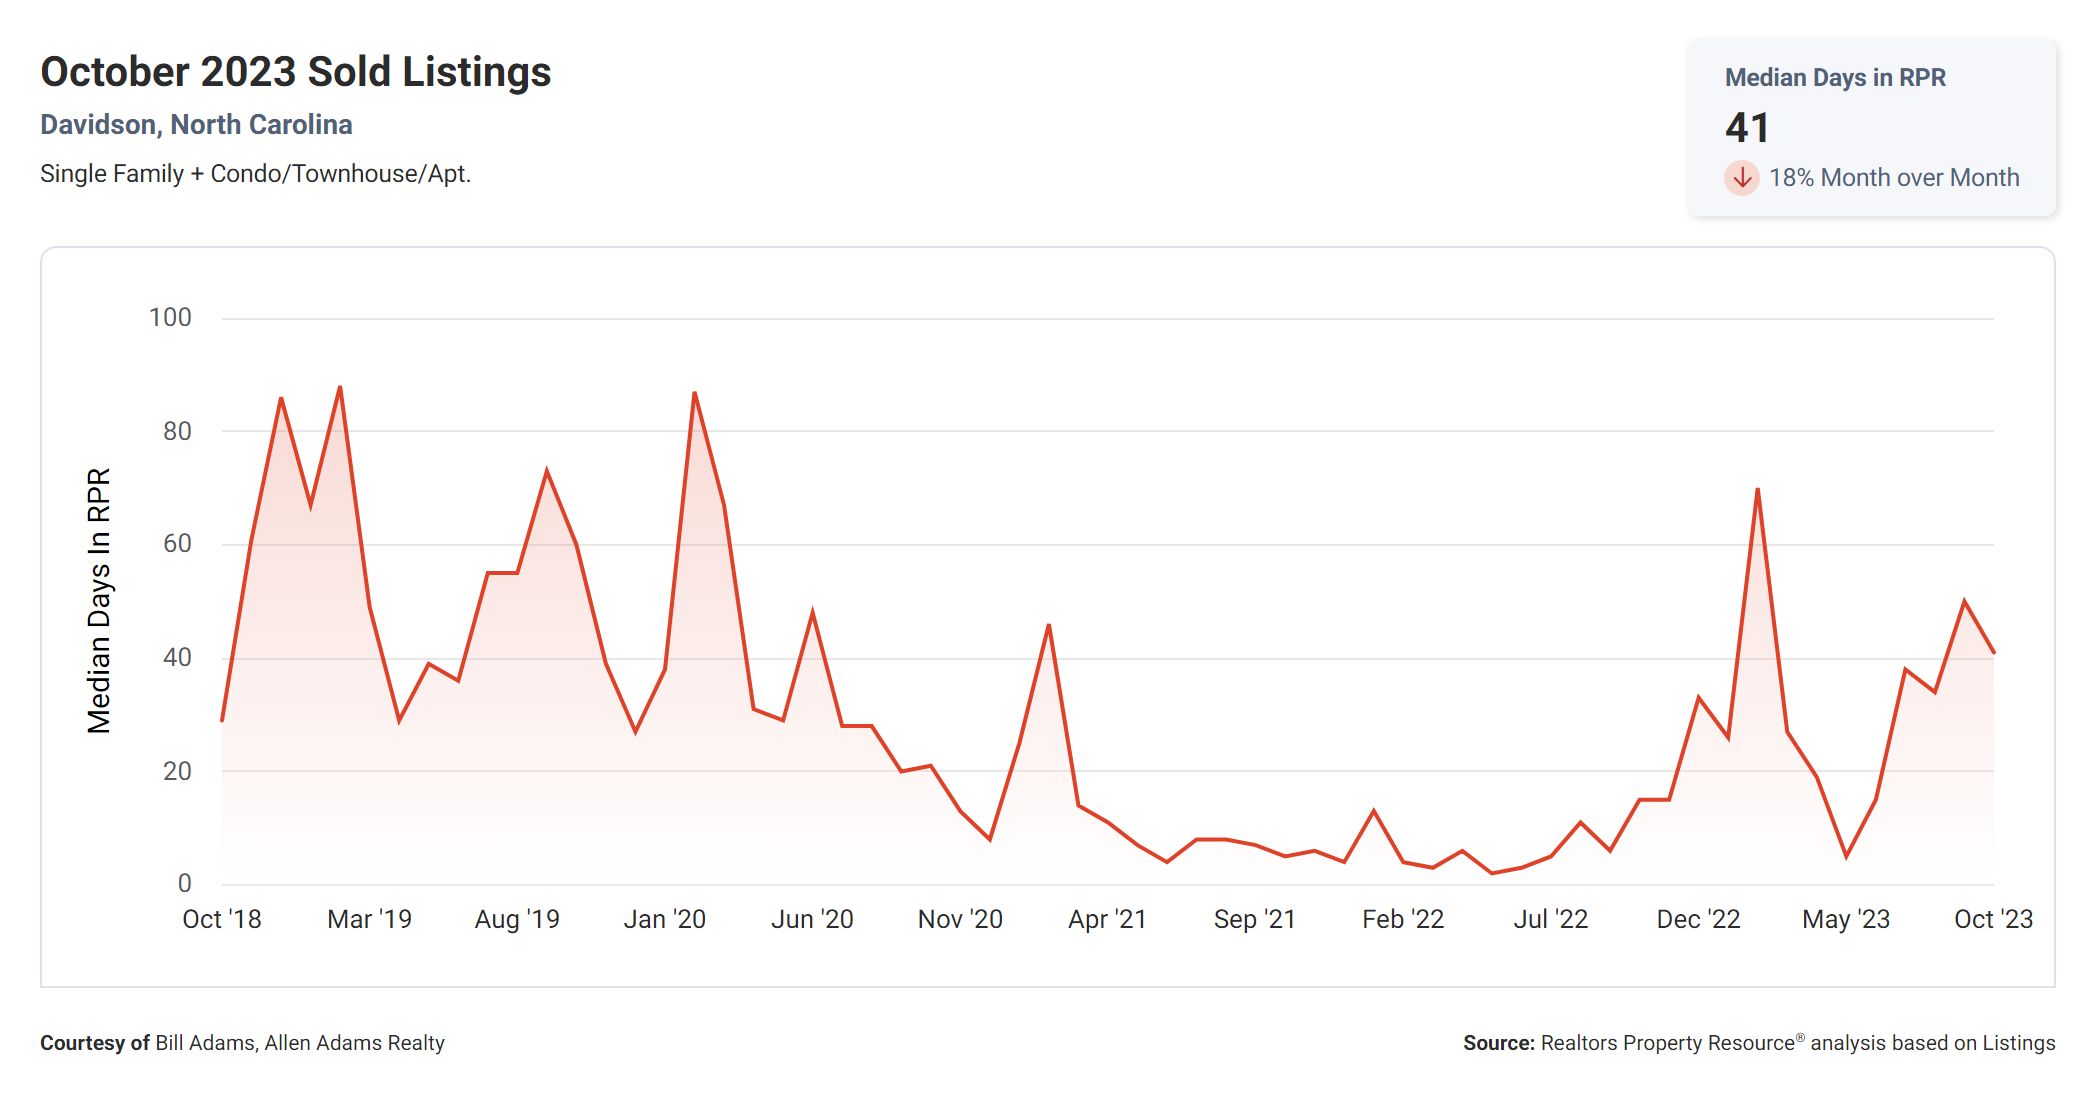
Moving on to the Median Days Homes are On the Market, we find a value of 41. This metric measures the average number of days it takes for homes to sell once they are listed on the market. A lower value indicates a faster-paced market, where homes sell quickly, while a higher value suggests a slower market with longer selling times. With a median of 41 days, we can conclude that homes in this market tend to sell relatively quickly, indicating a healthy level of demand.
Sale Price Versus List Price
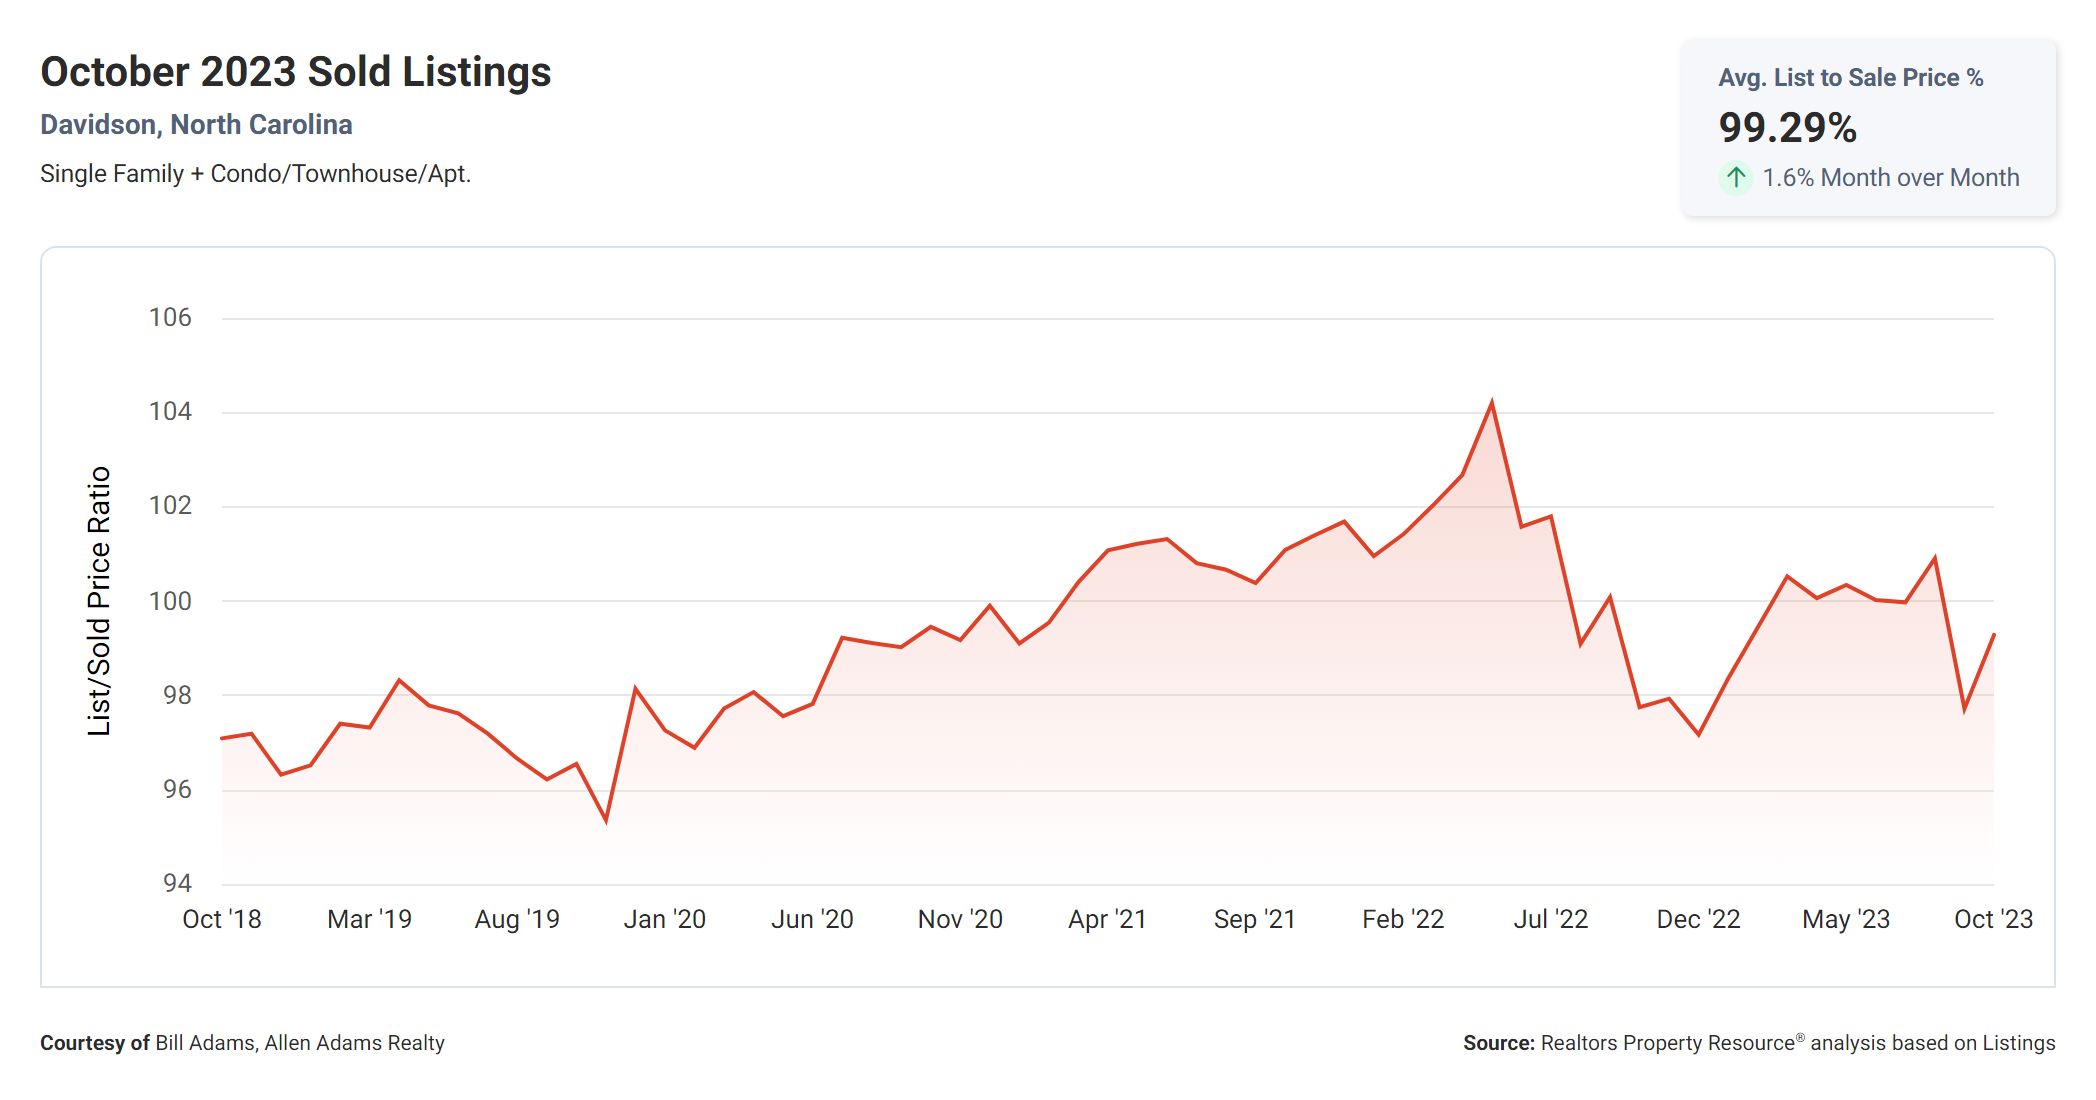
Now let’s consider the List to Sold Price Percentage, which currently stands at 99.3%. This metric measures the percentage of the listing price that a property actually sells for. A higher percentage suggests that sellers are able to sell their properties closer to their asking price, indicating a strong market with motivated buyers. In this case, a List to Sold Price Percentage of 99.3% indicates that sellers are generally able to achieve a price very close to their initial listing price.
Median Sold Price
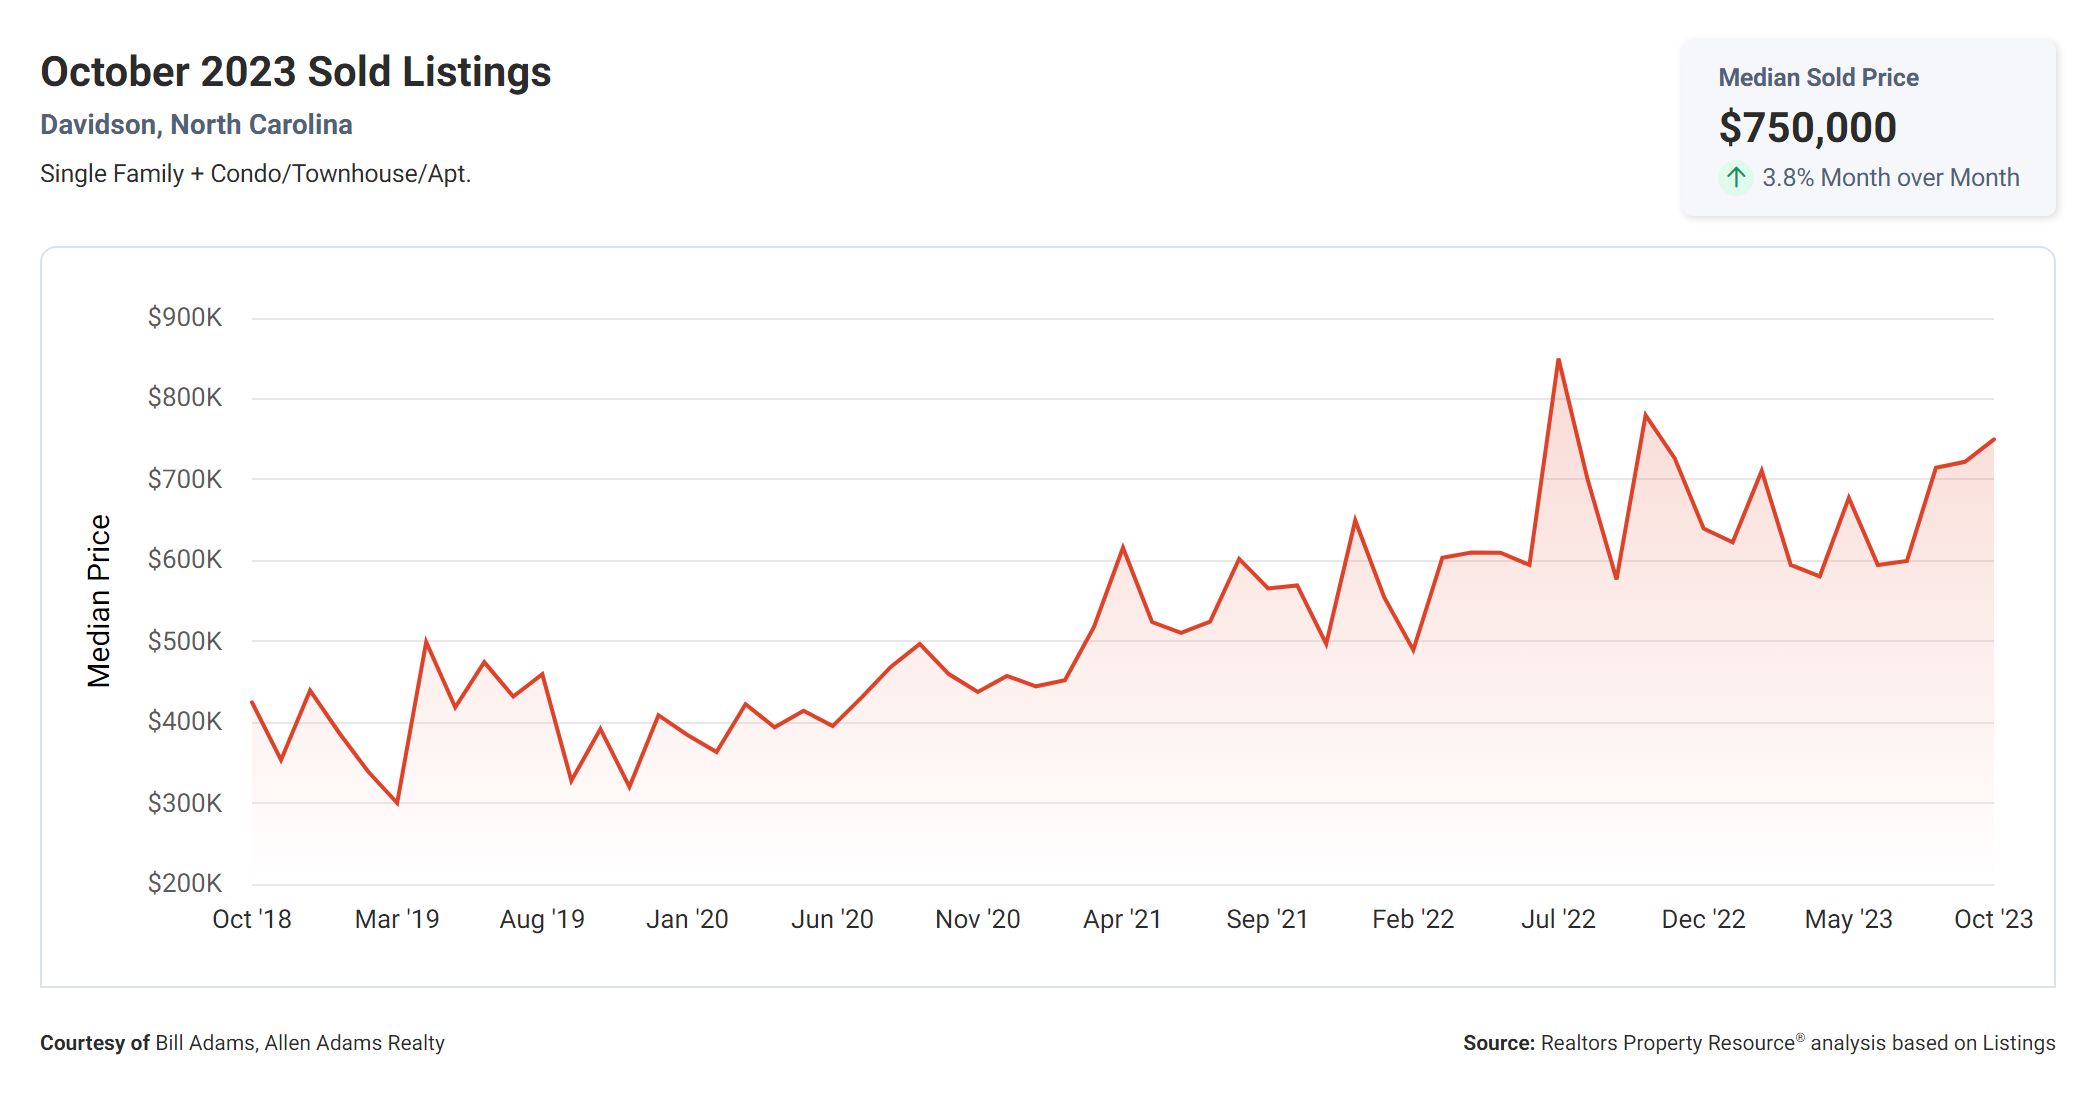
Lastly, we have the Median Sold Price, which is $750,000. This metric represents the middle point of all the sold prices in the market. It provides a snapshot of the average price at which properties are being sold. With a median sold price of $750,000, we can infer that the market consists of higher-end properties, which may attract buyers looking for more upscale homes.
What The Numbers Mean
In summary, these real estate metrics provide a comprehensive snapshot of the current market conditions. While the Months Supply of Inventory suggests a balanced market, the increase in the 12-Month Change in Months of Inventory indicates a growing supply. However, the Median Days Homes are On the Market shows that homes are selling relatively quickly, and the List to Sold Price Percentage suggests that sellers are receiving offers close to their asking price. Finally, the Median Sold Price of $750,000 indicates a strong demand for properties, resulting in higher prices.
Conclusion
As a buyer or seller, it’s important to consider these metrics when making your decisions. A balanced market with a growing supply can provide buyers with more options, while sellers can benefit from the high list to sold price percentage and strong demand. However, it’s always advisable to consult with a real estate professional who can provide personalized advice based on your specific situation.
Thank you for listening, and I hope this analysis has provided valuable insights into the current Davidson real estate market. Good luck with your buying or selling journey!
If you would like to see Davidson listings of homes for sale or learn more about the area click here.

