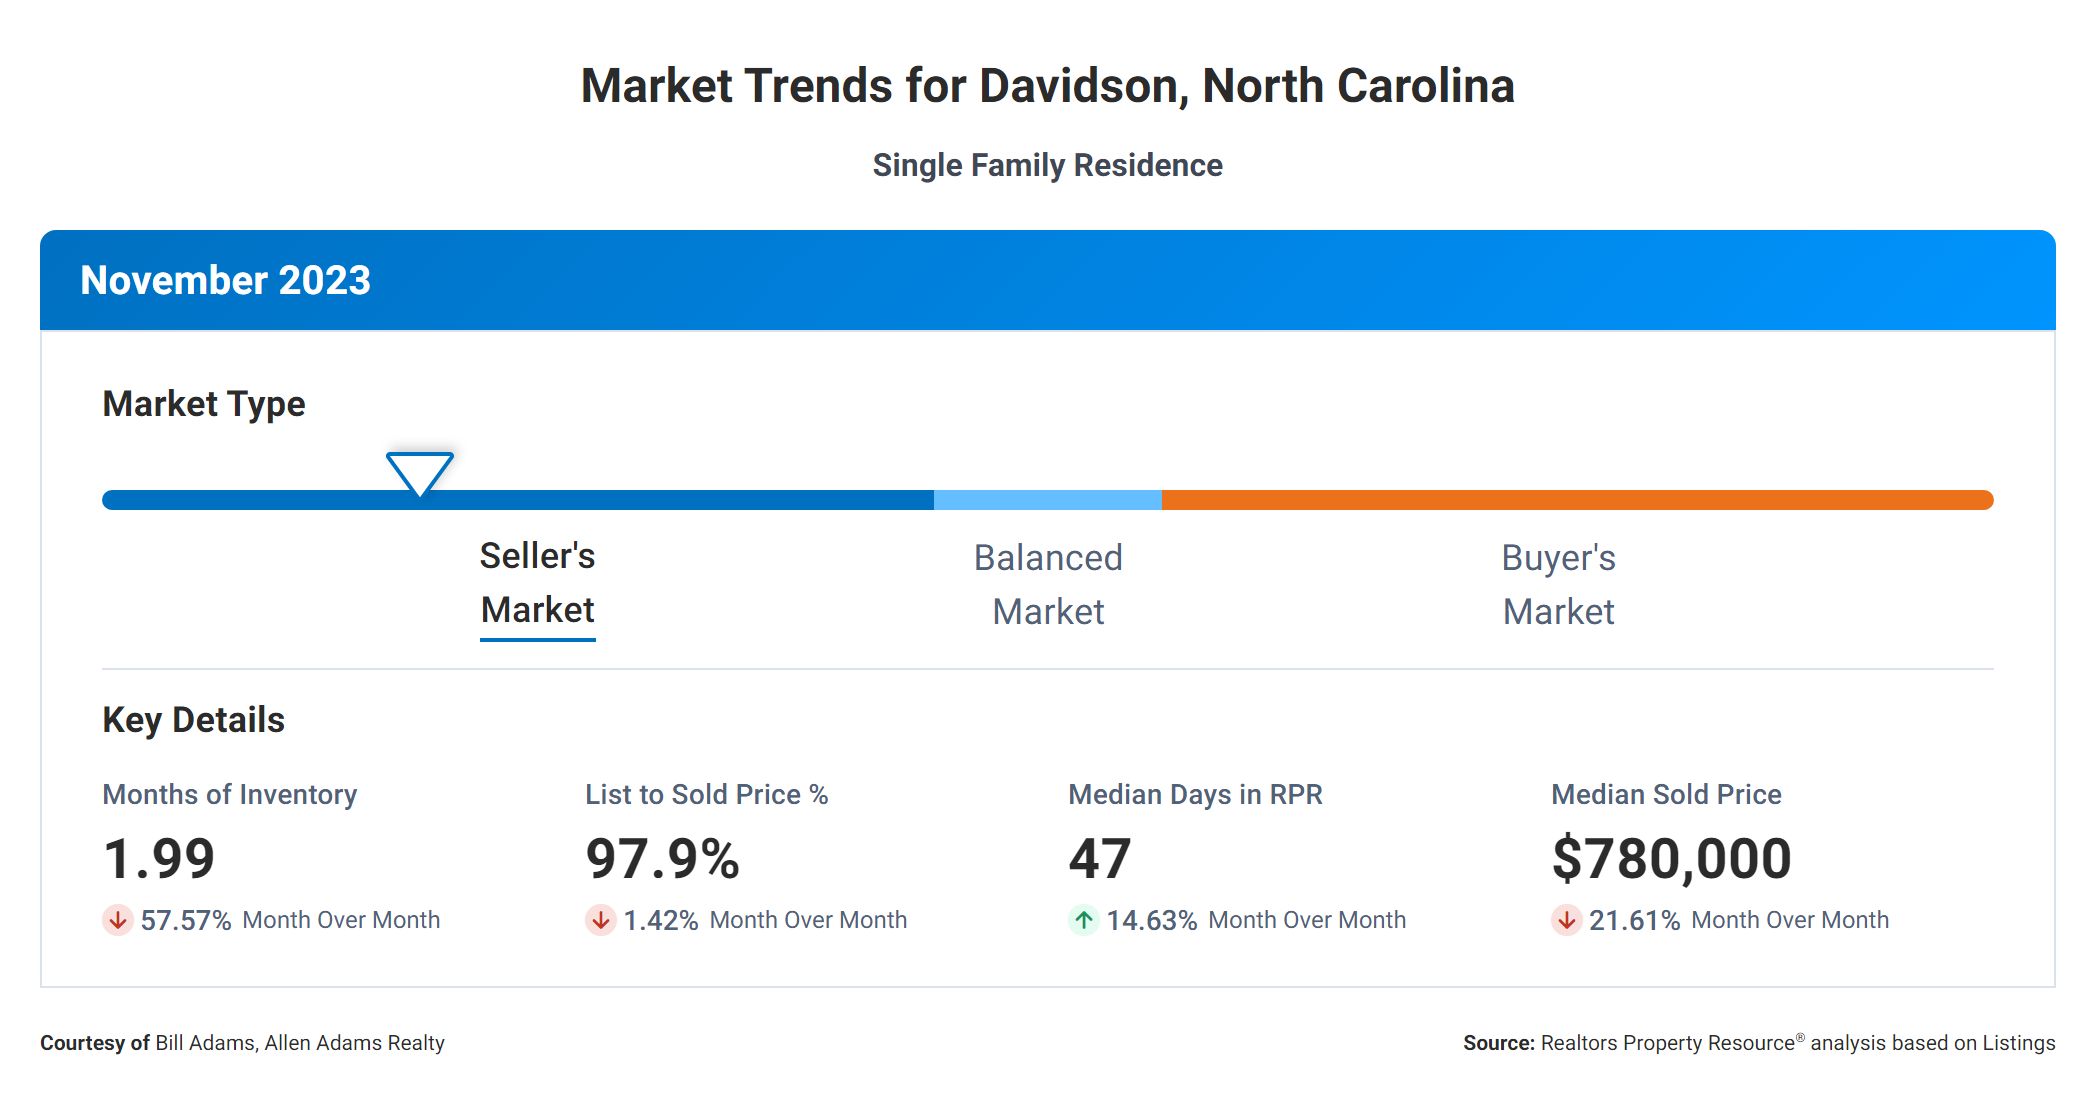
In the real estate market, there are several key metrics that can provide valuable insights for both buyers and sellers. By understanding the correlation between these metrics, you can make more informed decisions when it comes to buying or selling a property in Davidson, NC.
Months Supply
Let’s start by looking at the Months Supply of Inventory, which currently stands at 1.99. This metric represents the number of months it would take to sell all the available homes on the market, assuming no new listings are added. A lower number indicates a seller’s market, where demand exceeds supply, leading to potential bidding wars and higher prices.
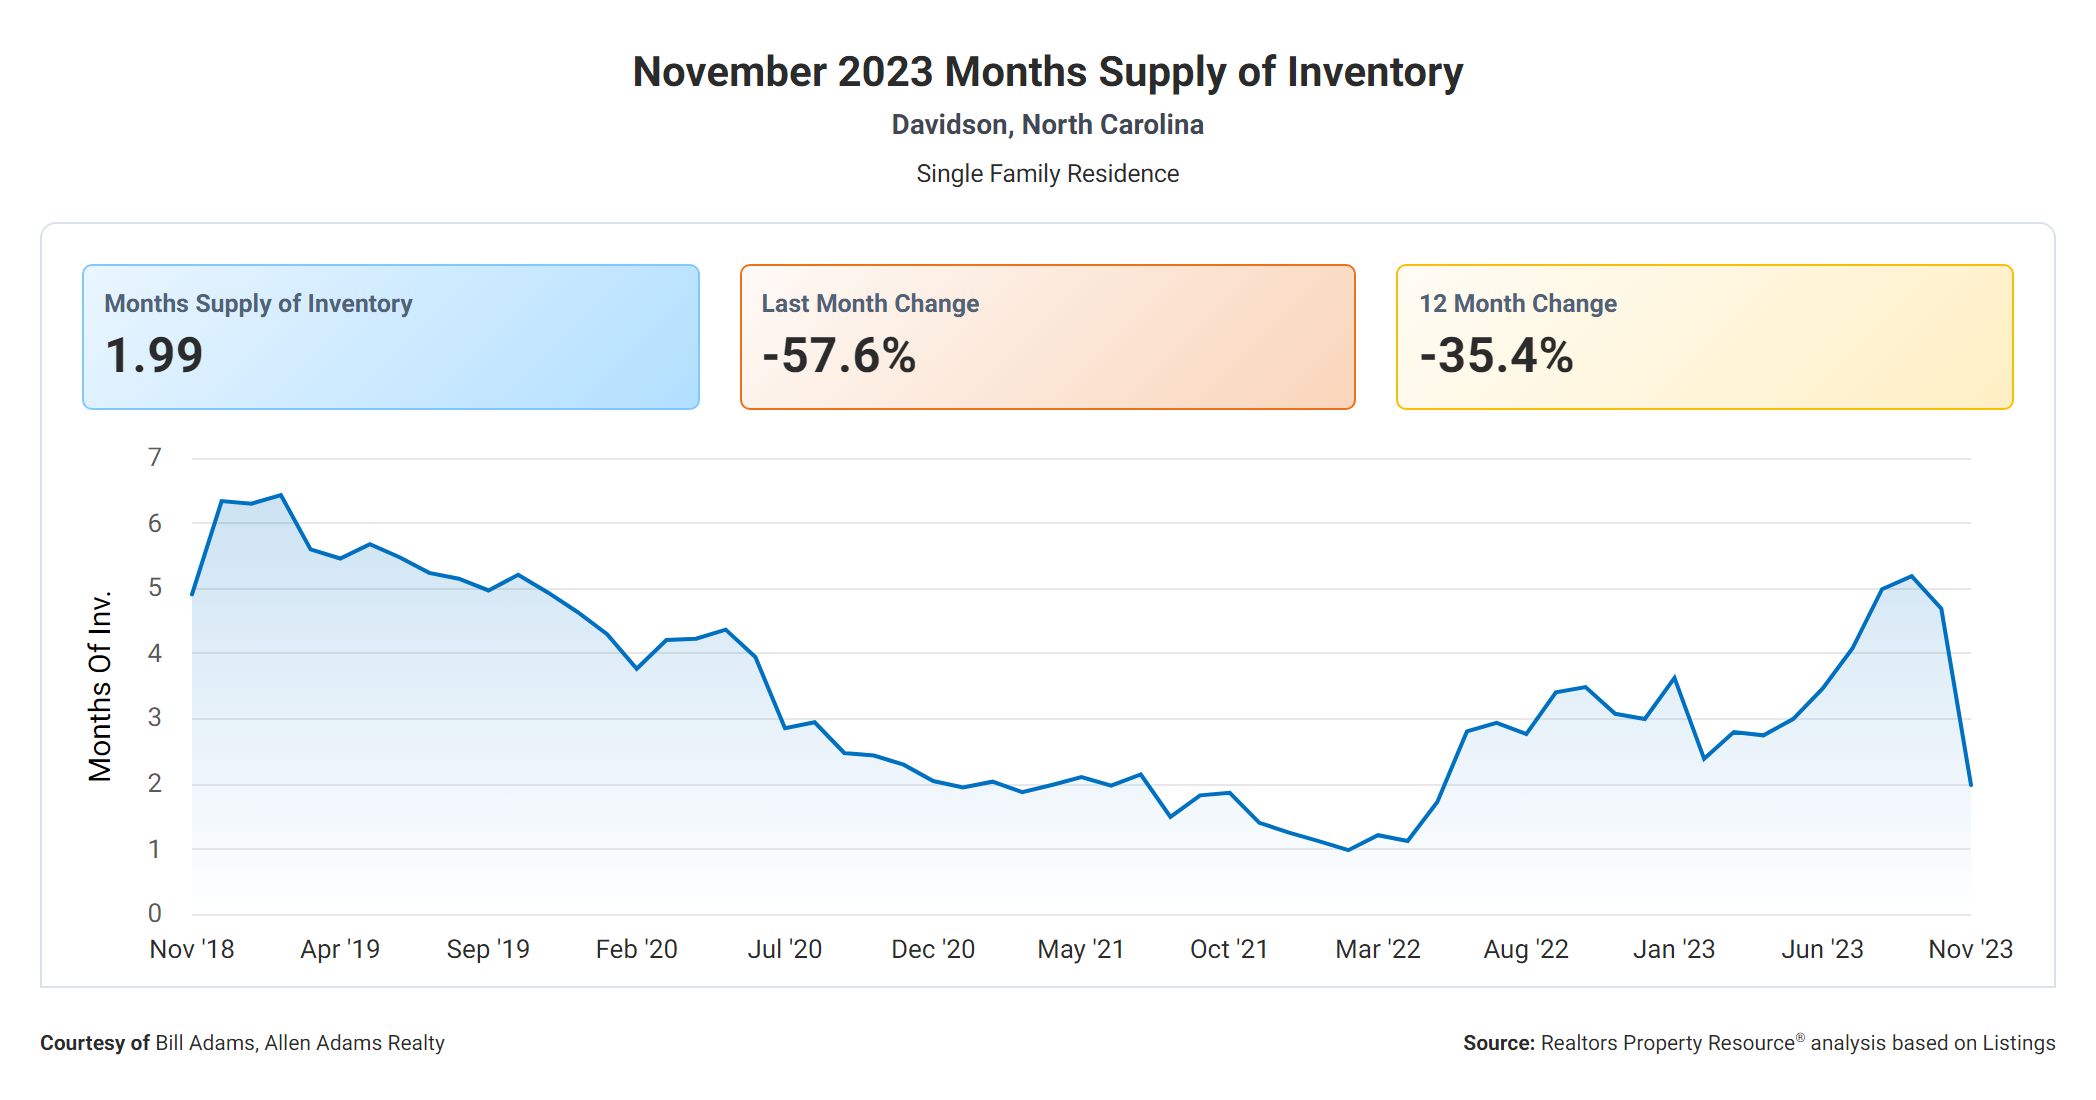
The 12-Month Change in Months of Inventory is another important metric, showing a decrease of -35.39%. This indicates that the supply of homes on the market has significantly decreased over the past year. This could be due to various factors such as increased demand, limited new construction, or a higher rate of homes being sold. The decrease in inventory suggests a competitive market where buyers may need to act quickly to secure a property.
Days On Market
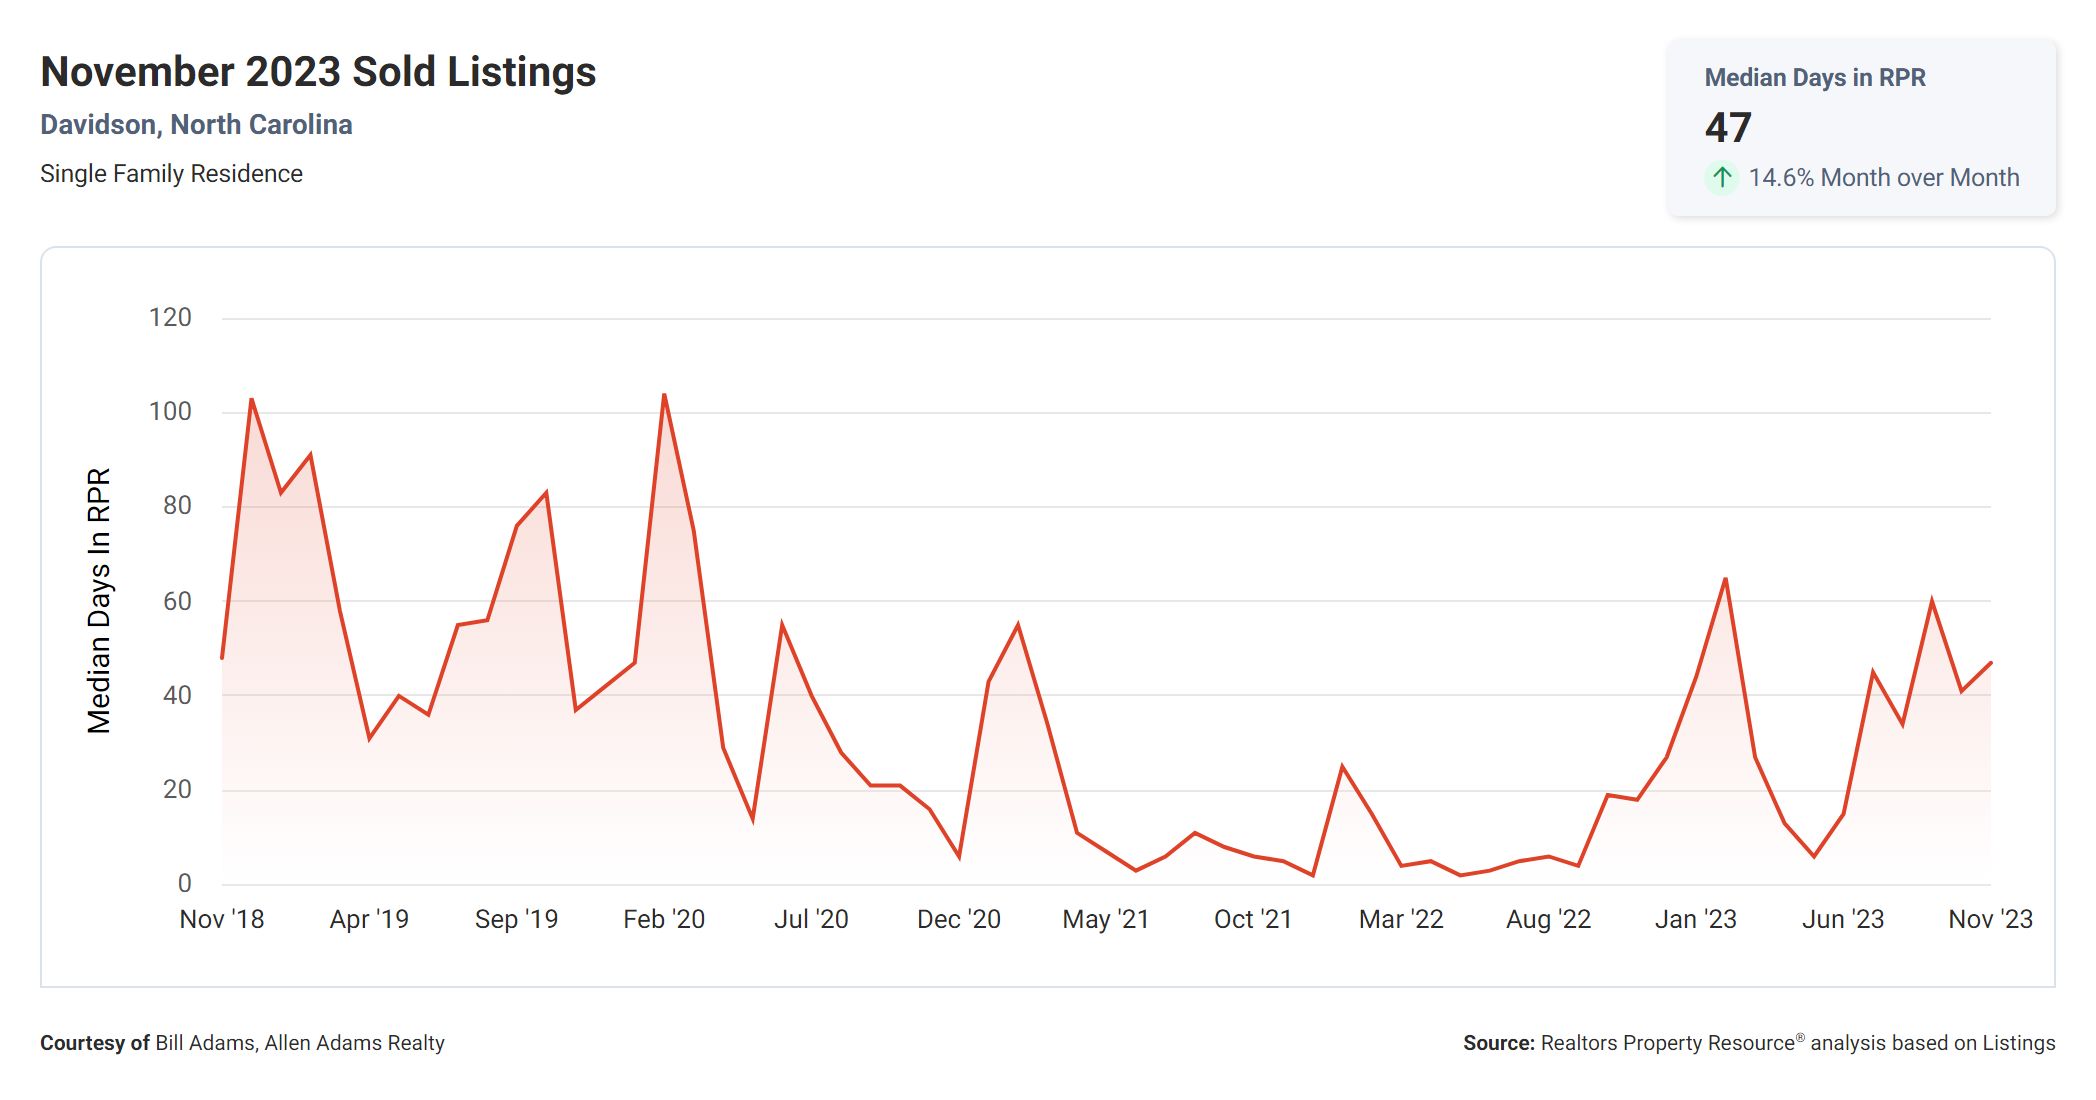
Moving on to the median Days Homes are On the Market, we see a figure of 47. This represents the average number of days it takes for a home to sell after being listed. A lower number suggests a faster-paced market, indicating high demand and potentially multiple offers on properties. Sellers can take advantage of this by pricing their homes competitively and attracting motivated buyers.
Sale Price Versus List Price
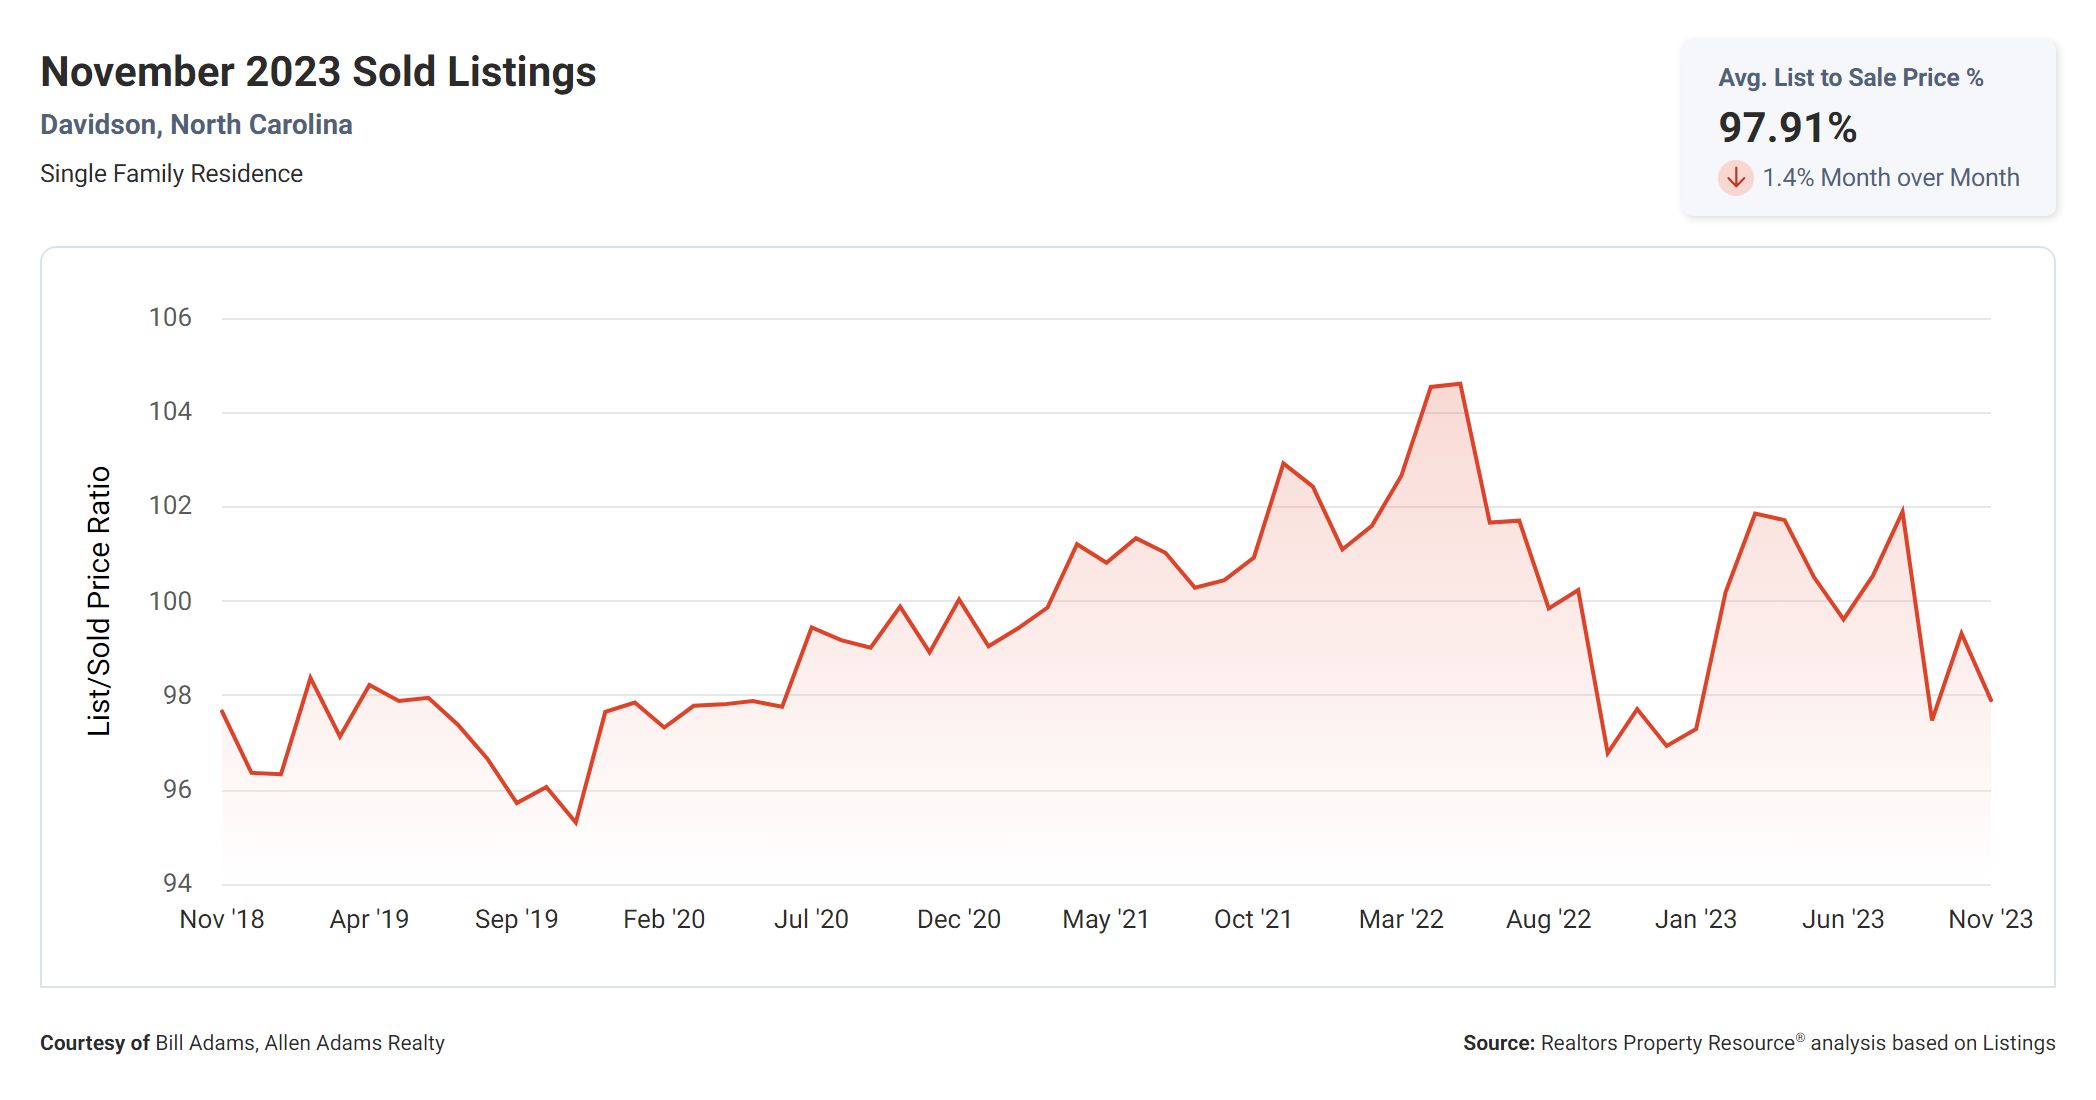
The List to Sold Price Percentage is another significant metric, currently standing at 97.9%. This percentage represents the ratio between the listing price and the final sold price of a property. A higher percentage indicates that sellers are achieving prices close to their asking price, potentially signaling a strong market and buyer competition. However, buyers should still conduct thorough market research to ensure they are making fair offers and not overpaying.
Median Sold Price
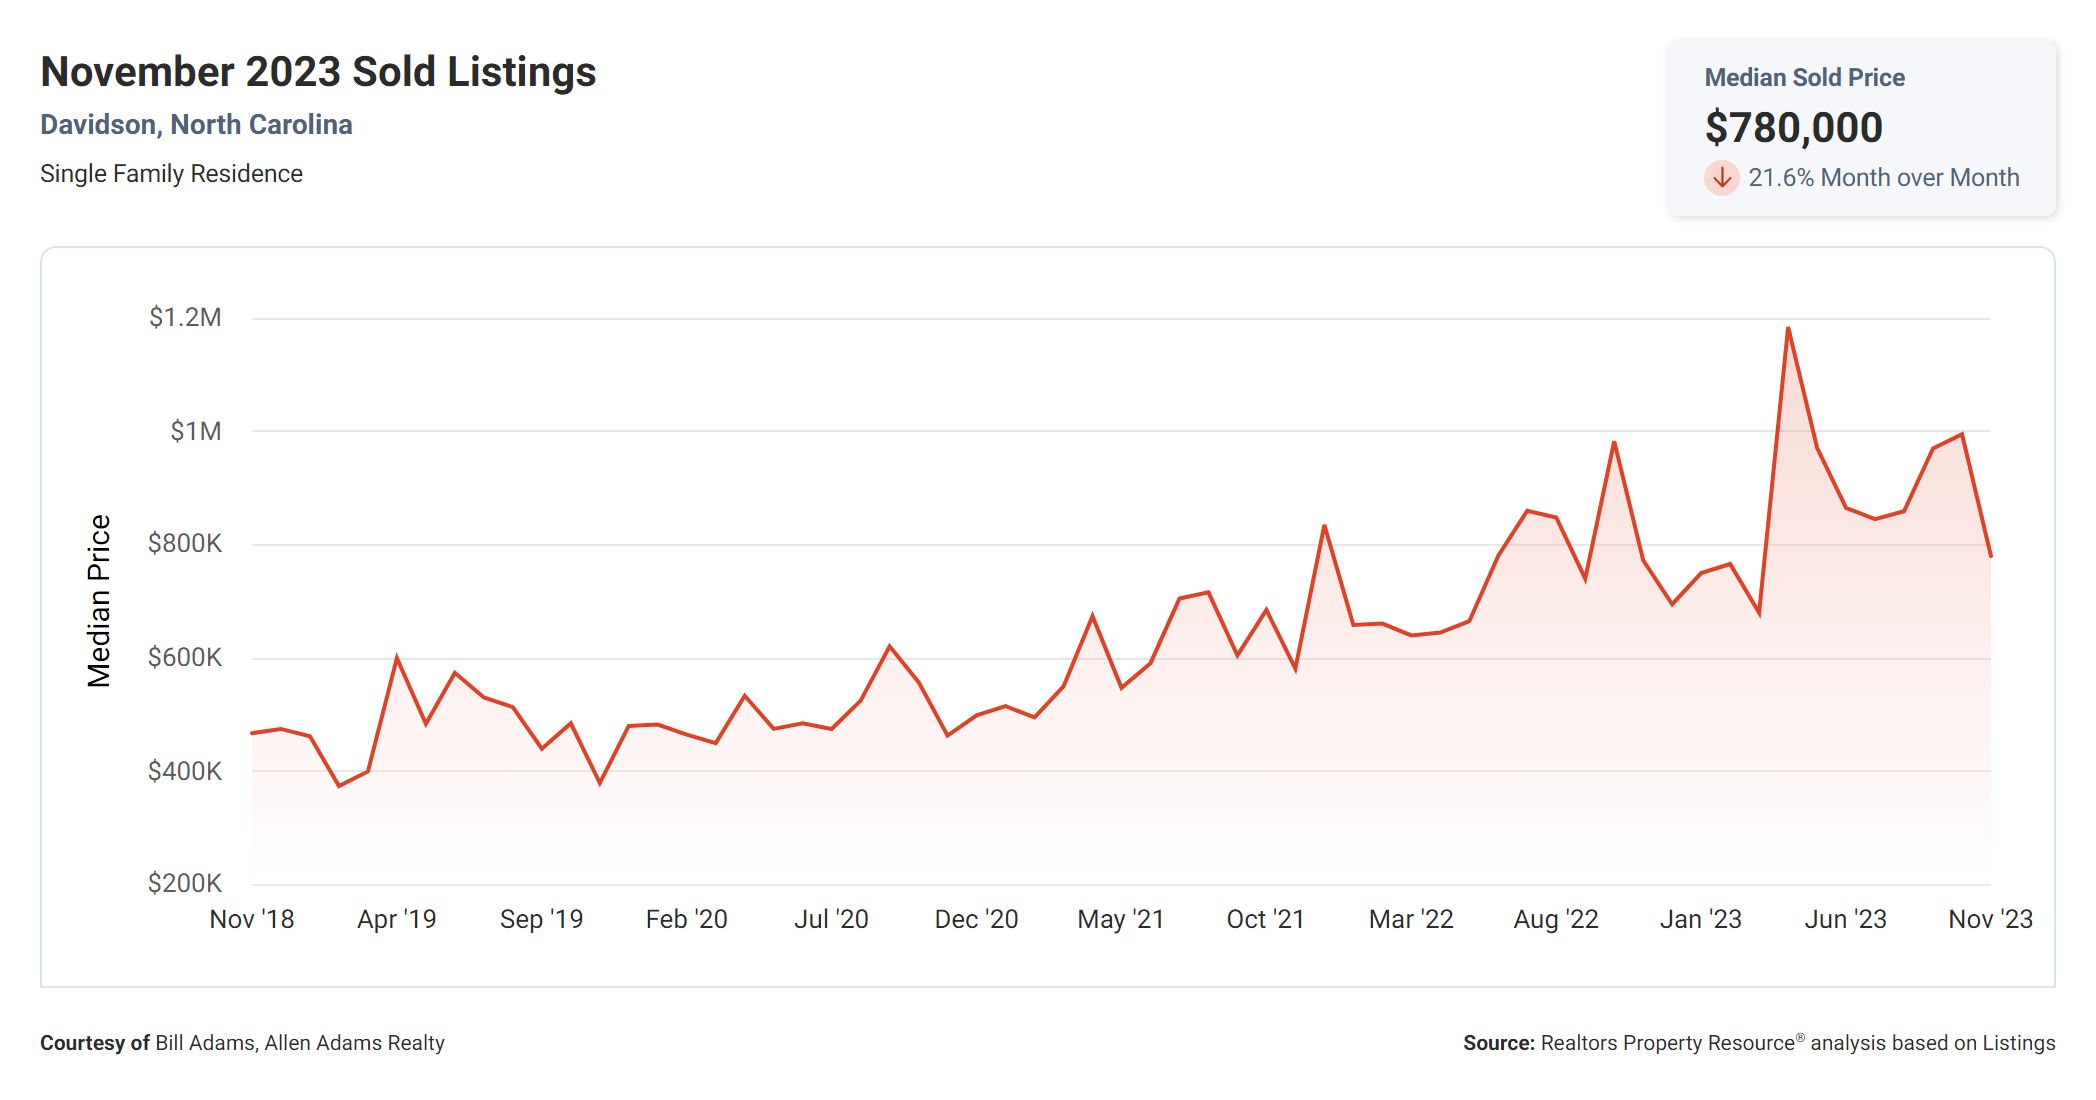
Lastly, the Median Sold Price is $780,000. This figure represents the midpoint of all the sold prices within a given time frame. It provides a snapshot of the market’s overall price range and can help both buyers and sellers gauge what they can expect in terms of pricing. Sellers can use this information to set realistic listing prices, while buyers can evaluate whether a property falls within their budget.
What The Numbers Mean
In summary, the correlation between these real estate metrics suggests a competitive market with limited supply and high demand. The low Months Supply of Inventory and decreasing 12-Month Change in Months of Inventory indicate a seller’s market, where buyers may face more competition. The relatively low median Days Homes are On the Market and high List to Sold Price Percentage further support this notion. Additionally, the Median Sold Price of $780,000 provides an idea of the market’s price range. Buyers and sellers should consider these metrics carefully to make informed decisions and navigate the real estate market successfully.
Conclusion
As buyers and sellers, it is essential to be aware of these metrics and understand their implications. Buyers may face increased competition and should be prepared to act swiftly, while sellers can take advantage of the strong demand and potentially obtain favorable prices for their properties. By staying informed and utilizing these metrics, both buyers and sellers can make informed decisions that align with their goals in the ever-changing real estate market.
Thank you for listening, and I hope this analysis has provided valuable insights into the current Davidson real estate market. Good luck with your buying or selling journey!
Ready To Make Davidson, NC Your Home?
Davidson, NC Homes For Sale

