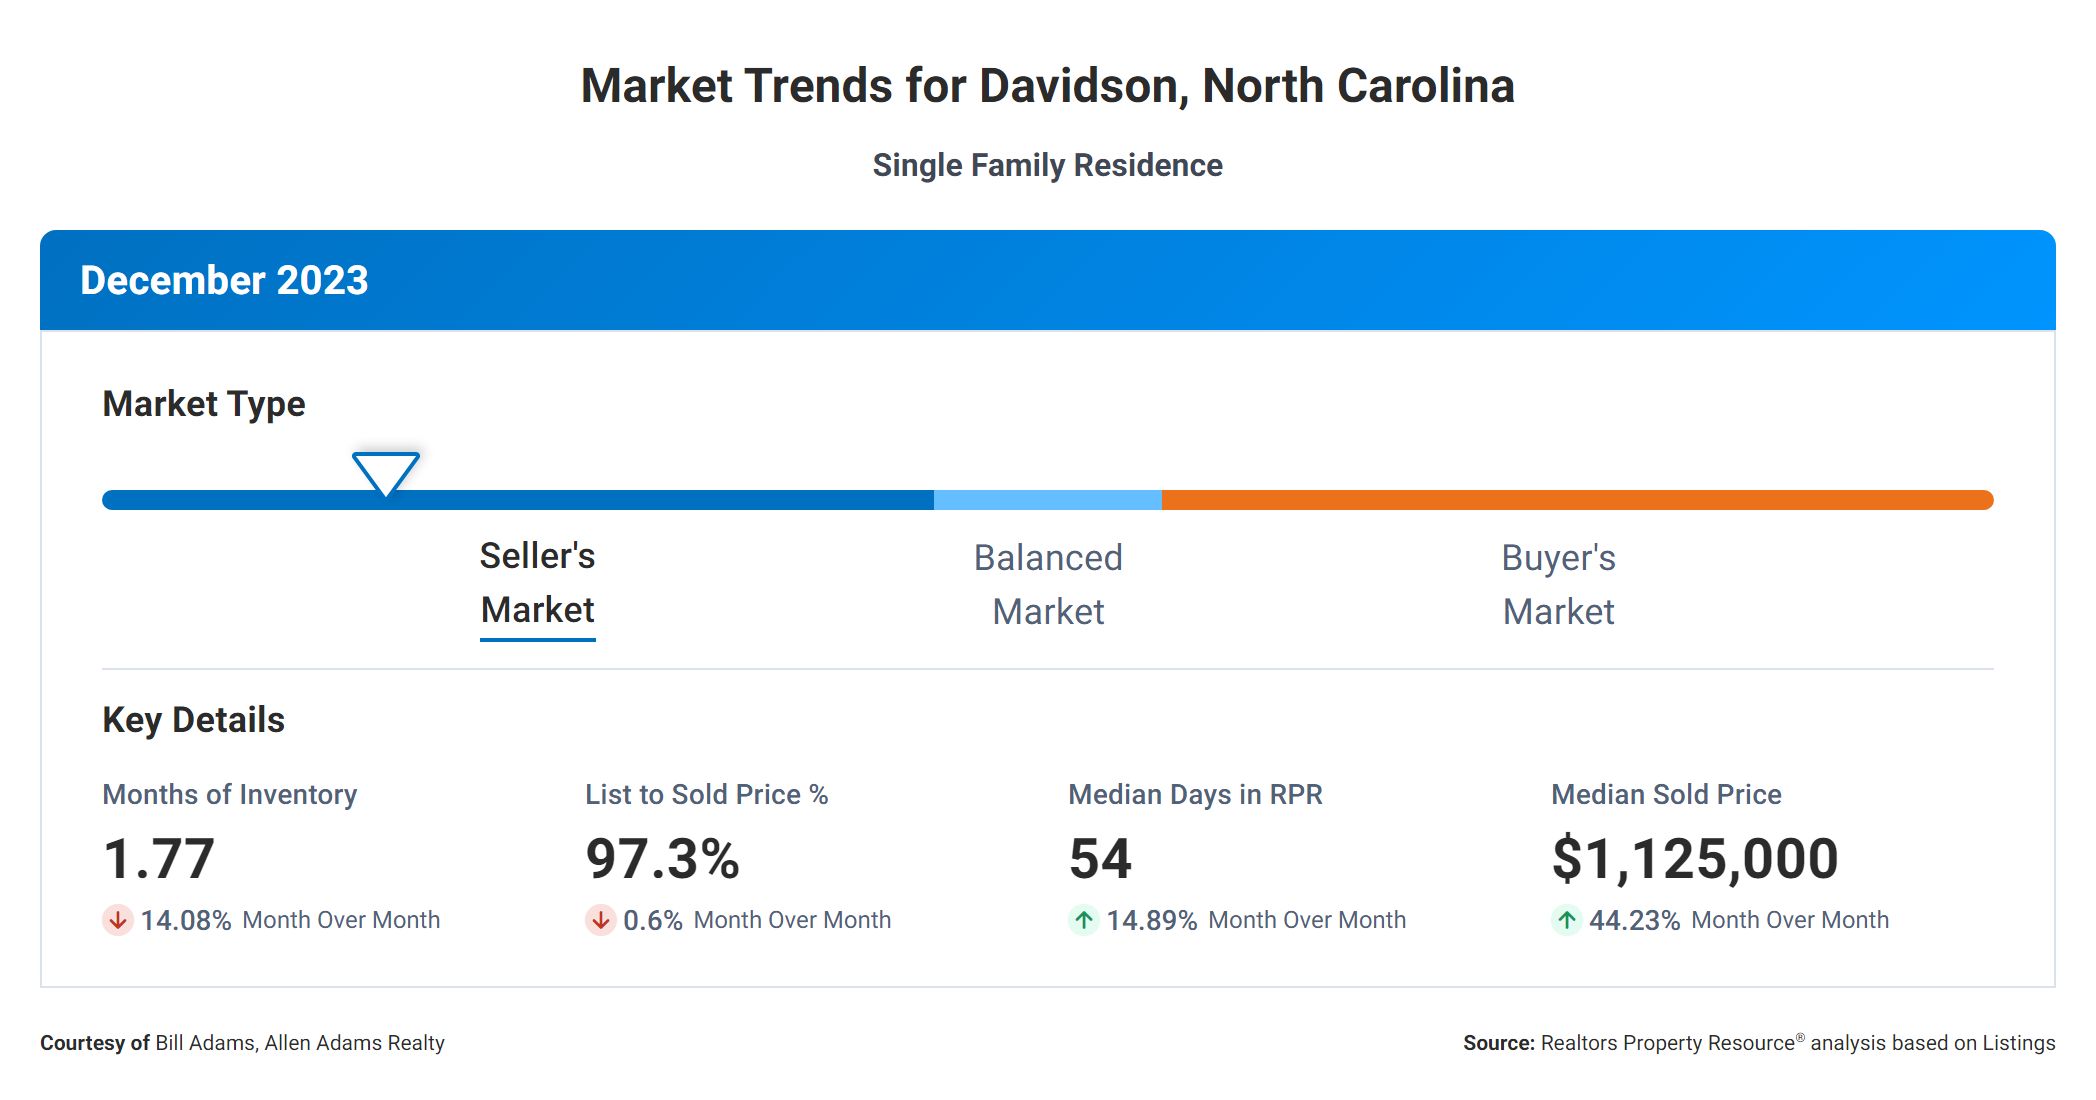
Davidson, NC Real Estate Trends For December 2023
The Davidson real estate market is a dynamic space, and understanding various metrics can help both buyers and sellers make informed decisions. Let’s analyze the correlation between some key real estate metrics to provide valuable insights for our target audience.
Months Supply
One significant metric to consider is the “Months Supply of Inventory,” which currently stands at 1.77. This metric measures the number of months it would take to sell all available homes on the market if no new listings were added. A lower number indicates a seller’s market, where demand exceeds supply, leading to potentially higher prices and faster sales.
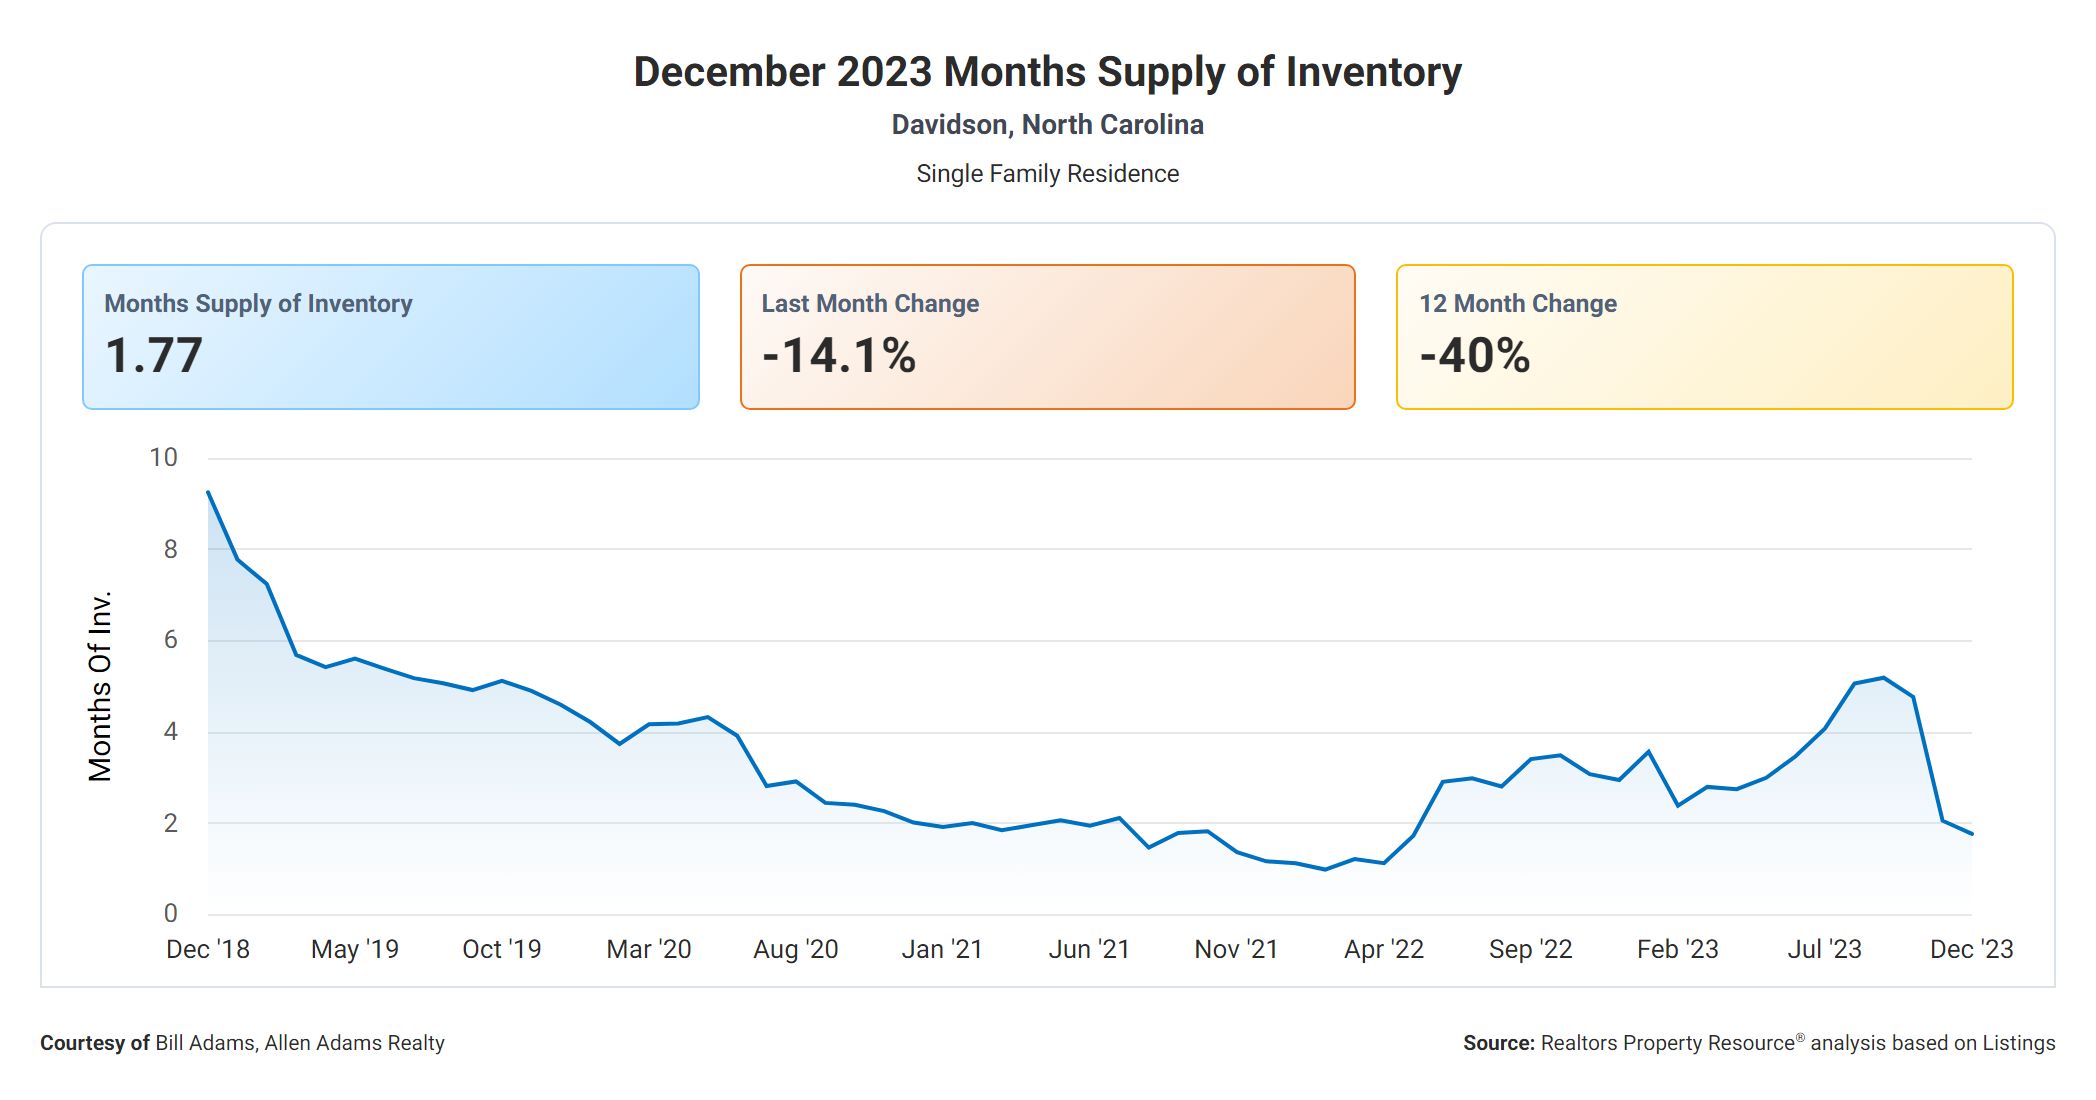
In conjunction with the Months Supply of Inventory, it’s crucial to examine the “12-Month Change in Months of Inventory,” which indicates a -40% decrease. This percentage represents the change in the number of months it would take to sell all inventory compared to the previous year. A negative value signifies a decrease in inventory, suggesting a competitive market with limited options for buyers. In such a scenario, sellers may have more leverage in negotiations.
Days On Market
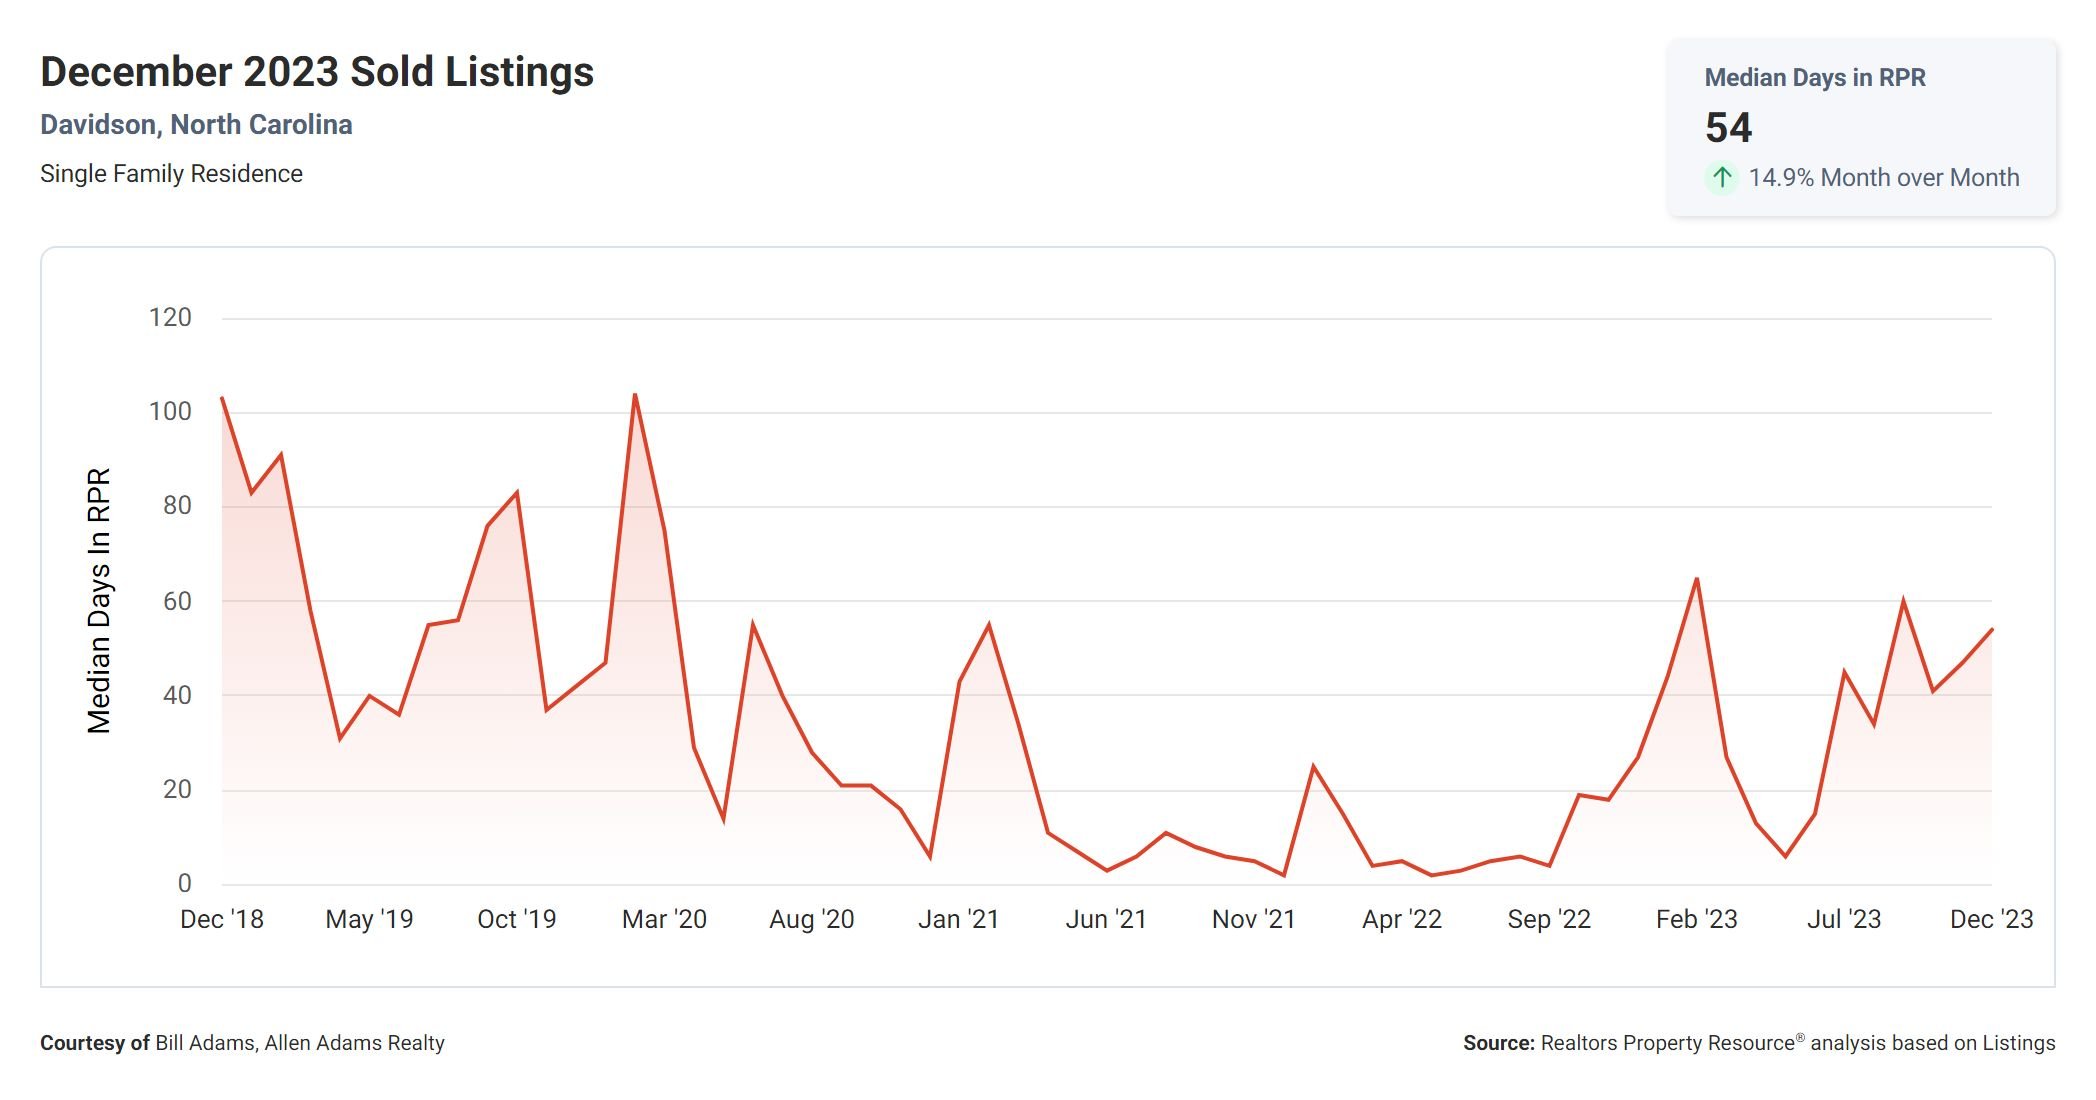
Another critical metric to consider is the “Median Days Homes are On the Market,” which currently stands at 54 days. This metric measures the average number of days it takes for a home to go from listing to being sold. A lower number typically indicates a robust market where homes are selling quickly, reflecting high demand and competitive bidding among buyers.
Sale Price Versus List Price
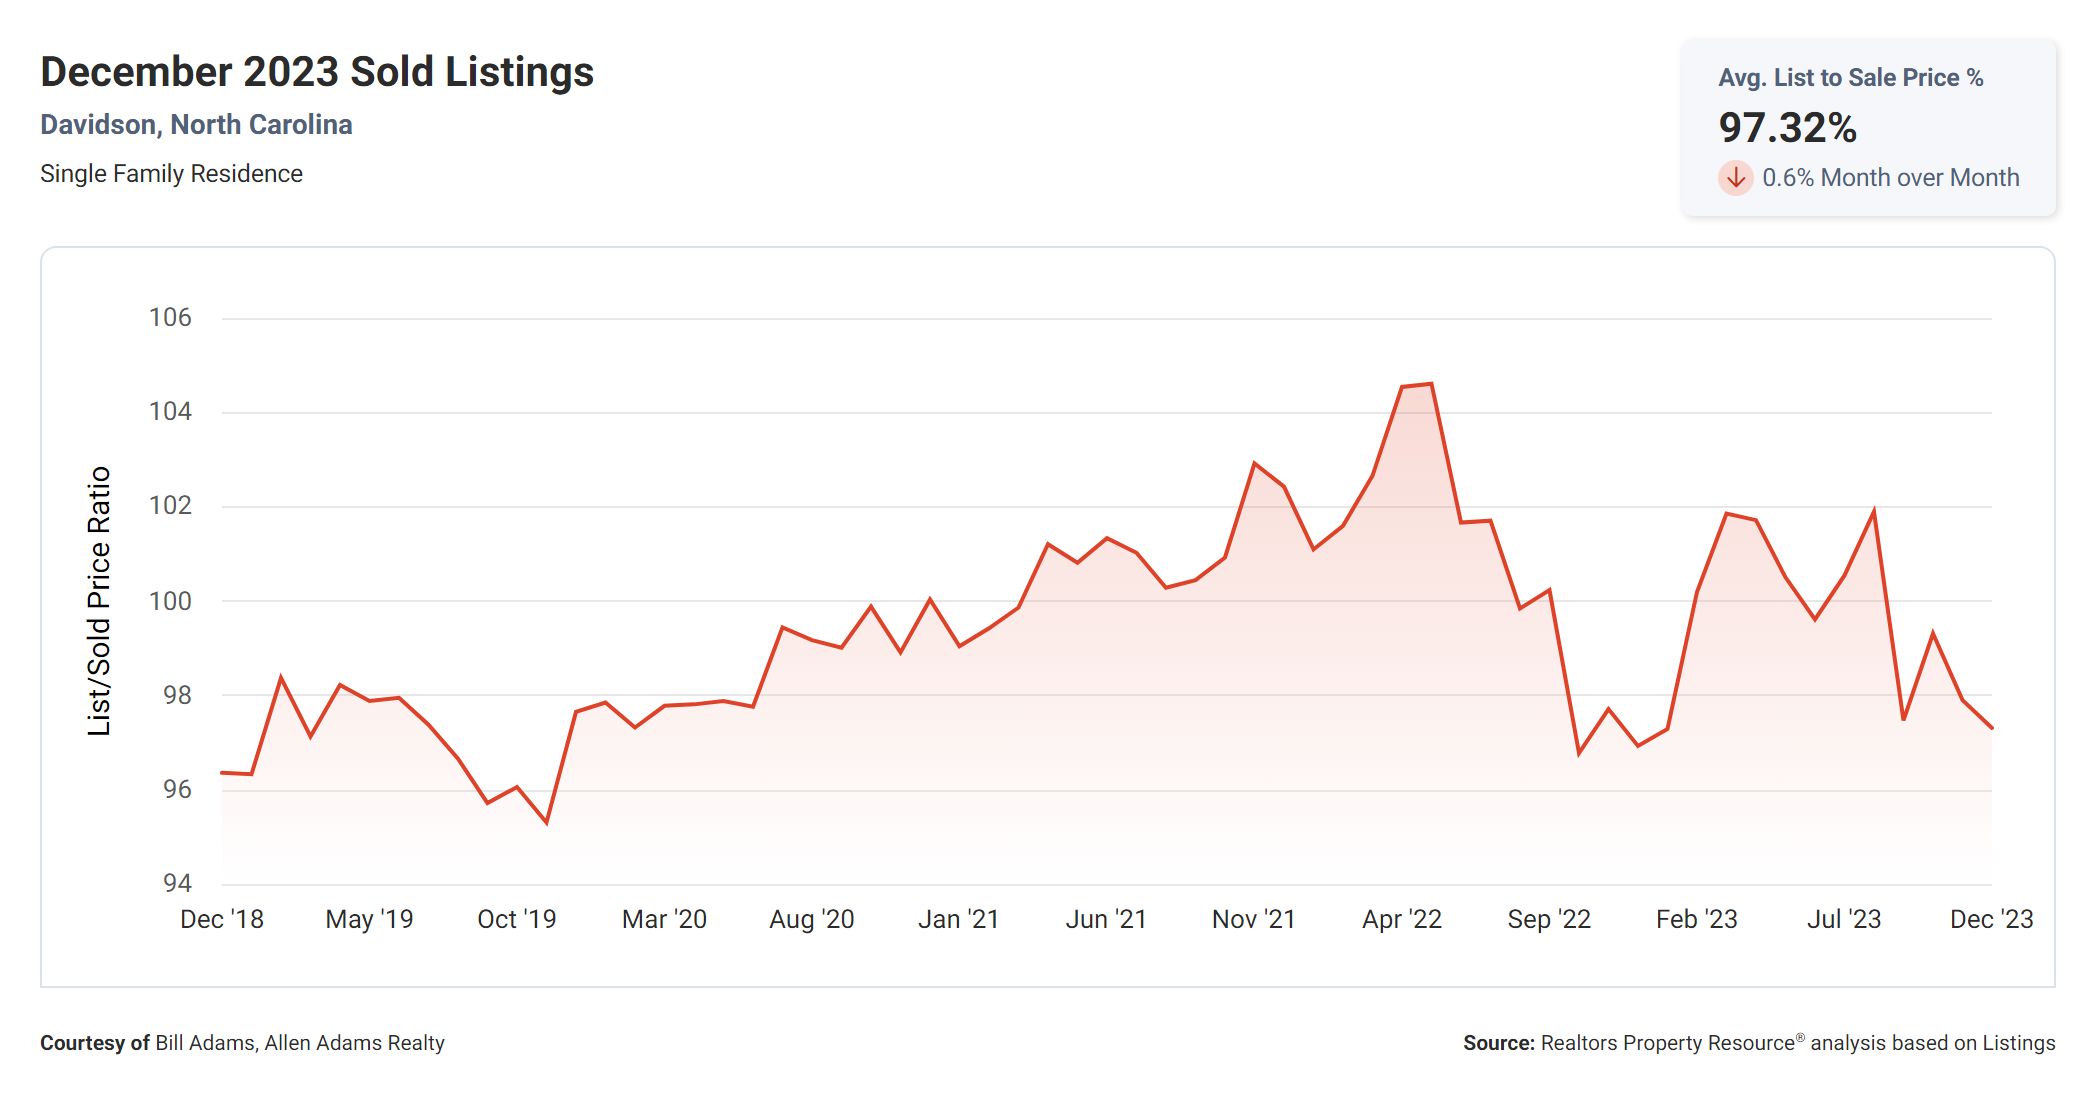
To gauge the pricing dynamics, we can examine the “List to Sold Price Percentage,” which sits at 97.3%. This metric represents the percentage of the listing price that homes ultimately sell for. A higher percentage suggests that homes are selling close to or above their asking prices. This data indicates that sellers have relatively strong negotiating power, and buyers may need to be prepared to make competitive offers.
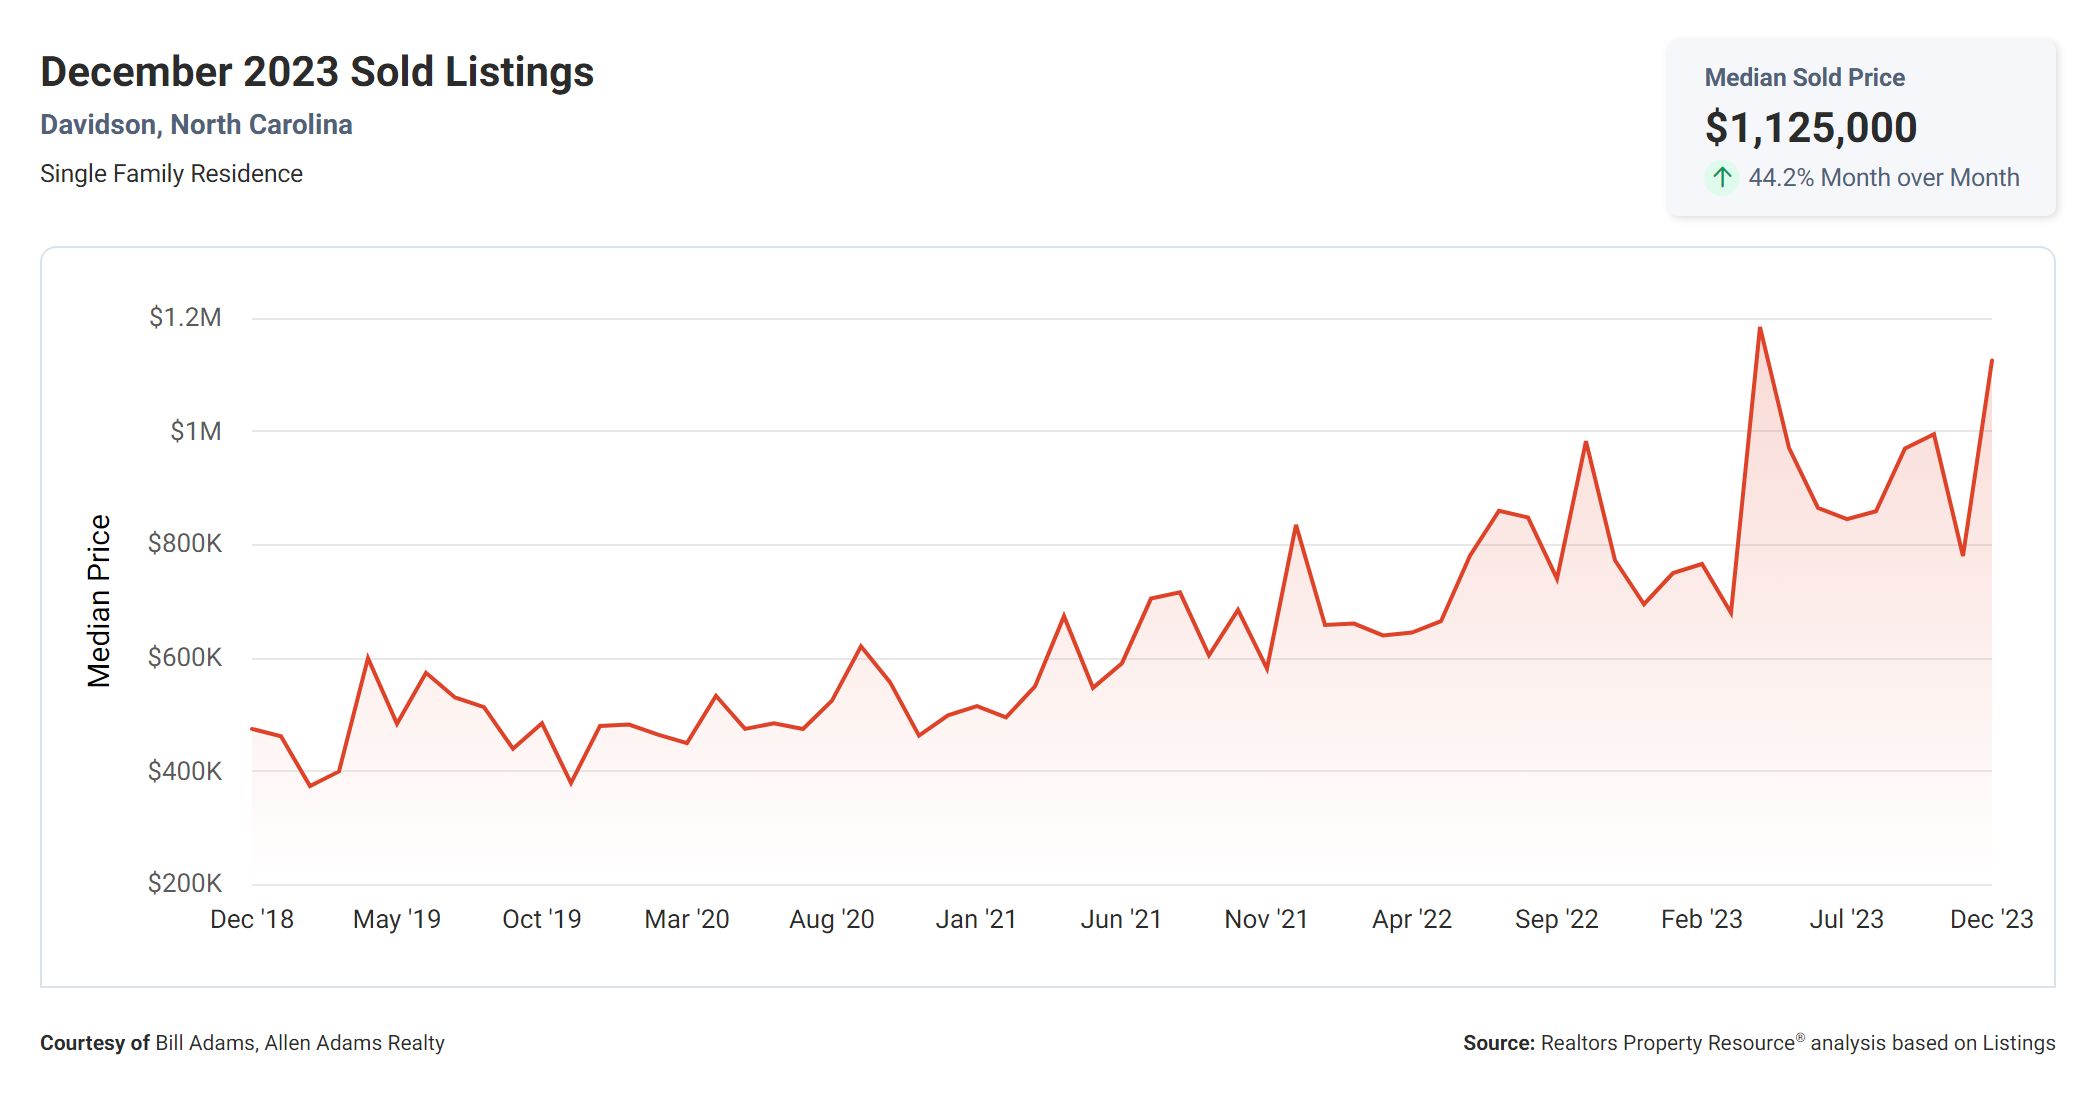
Median Sold Price
Lastly, we have the “Median Sold Price,” which currently stands at $1,125,000. This figure represents the middle point of all homes sold in a given period, where half the homes sold for more and half for less. It provides a snapshot of the overall pricing trends in the market. A higher median sold price indicates a more affluent market, which may be attractive to sellers but could pose challenges for buyers seeking more affordable options.
What The Numbers Mean
In summary, the real estate metrics paint an interesting picture for both buyers and sellers. With a low Months Supply of Inventory and a significant decrease in the 12-Month Change in Months of Inventory, sellers can expect a competitive market with potential for higher prices. The Median Days Homes are On the Market suggest that homes are selling relatively quickly, while the List to Sold Price Percentage indicates sellers have strong negotiating power. However, buyers should be prepared for competitive bidding and potentially paying close to or above the listing price. The Median Sold Price of $1,125,000 suggests a higher-end market, which may attract sellers but require buyers to consider their budget carefully.
Conclusion
By understanding these metrics, both buyers and sellers can navigate the real estate market more effectively and make well-informed decisions.
Thank you for listening, and I hope this analysis has provided valuable insights into the current Davidson real estate market. Good luck with your buying or selling journey!
Ready To Make Davidson, NC Your Home?
Davidson, NC Homes For Sale

