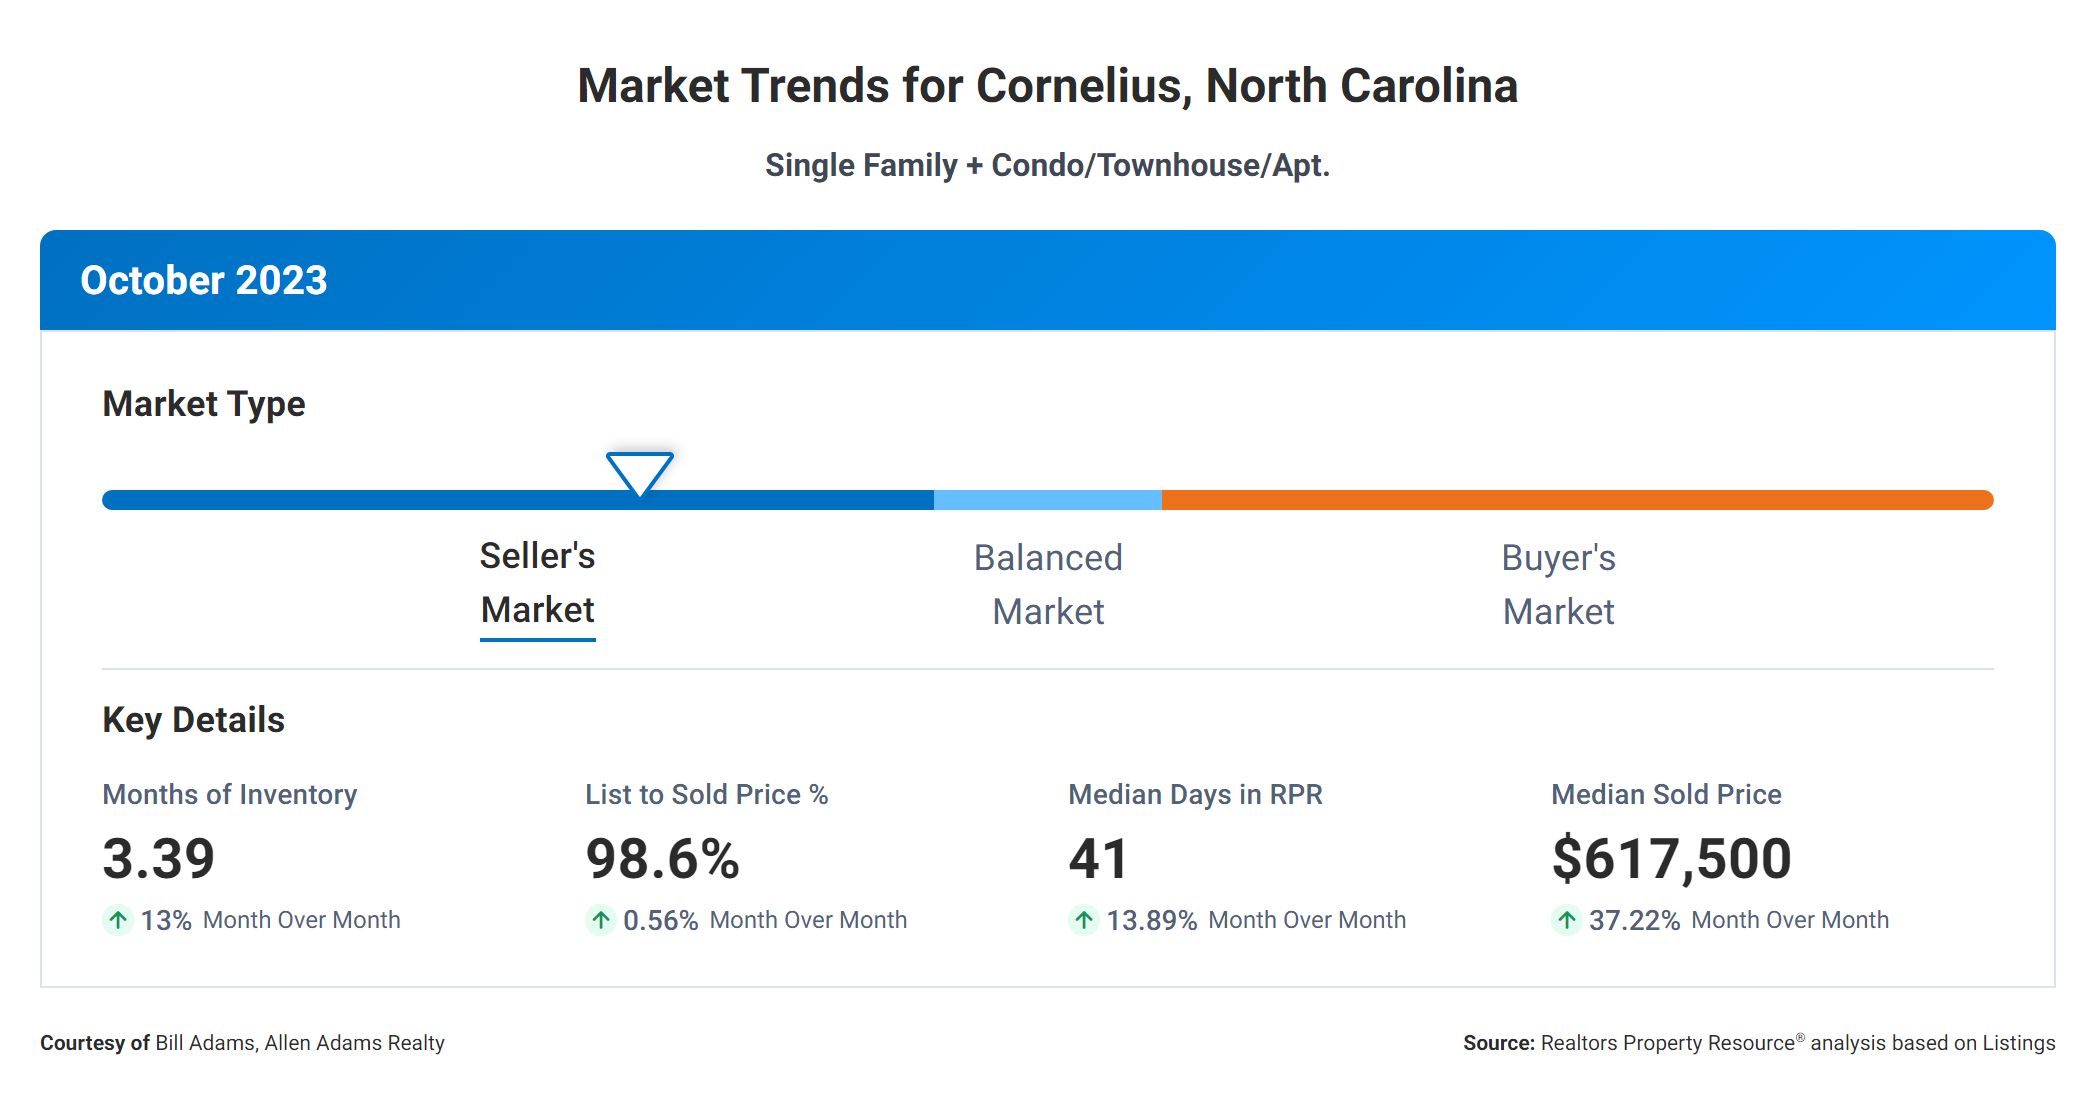
When it comes to understanding the current real estate market for Cornelius, NC, there are several important metrics that can provide valuable insights for both buyers and sellers. Let’s dive into these metrics for October 2023 and explore the correlations between them to help you make informed decisions.
Months Supply
First, let’s talk about the “Months Supply of Inventory,” which is currently sits at 3.39. This metric represents the number of months it would take to sell all the available homes on the market, assuming no new listings are added. A lower number indicates a seller’s market, with limited inventory and potentially higher prices.
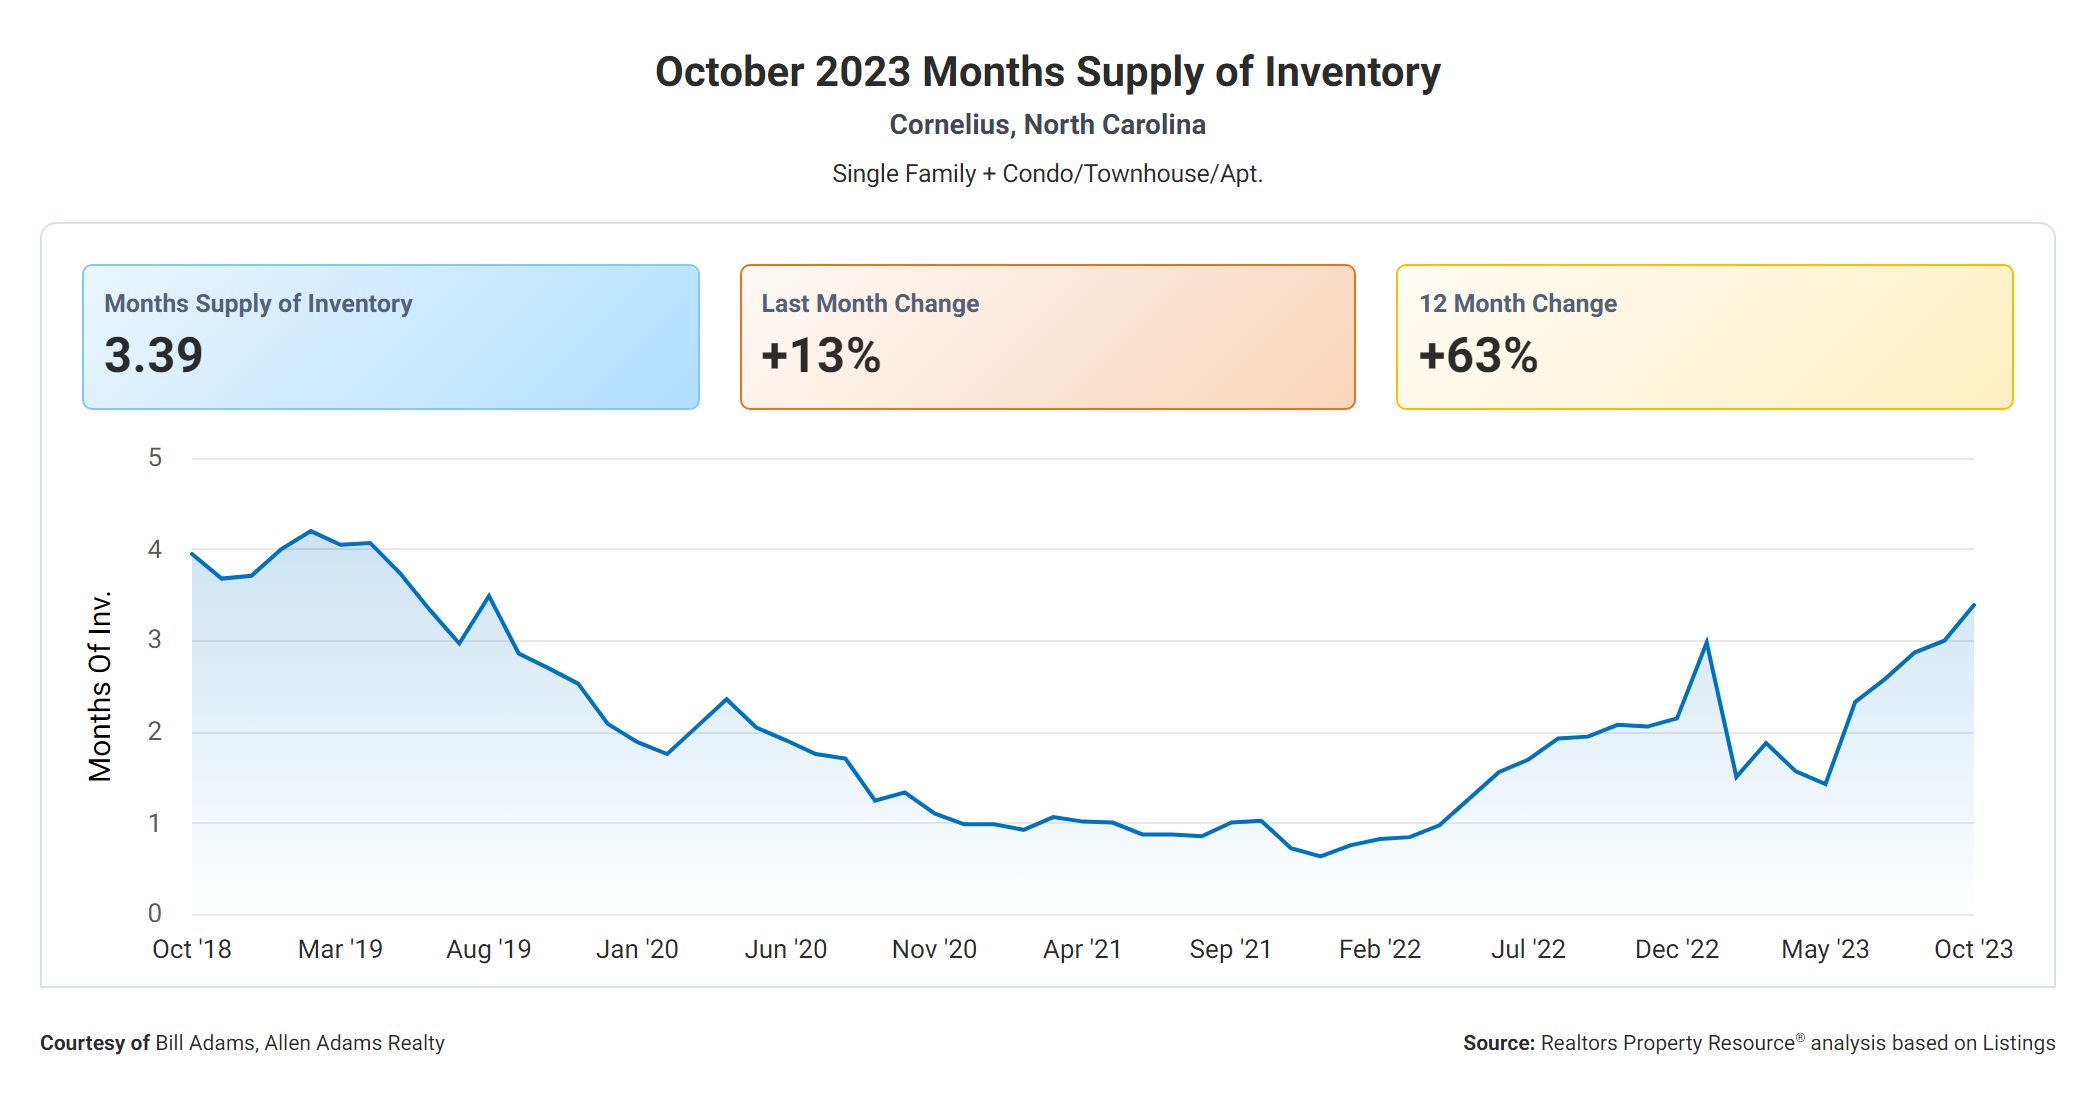
Now, let’s look at the “12-Month Change in Months of Inventory,” which shows a significant increase of +62.98%. This indicates a substantial shift in the real estate market over the past year, with a significant increase in the number of available homes for sale. This increase in supply can lead to more balanced market conditions, potentially giving buyers more options to choose from.
Days On Market
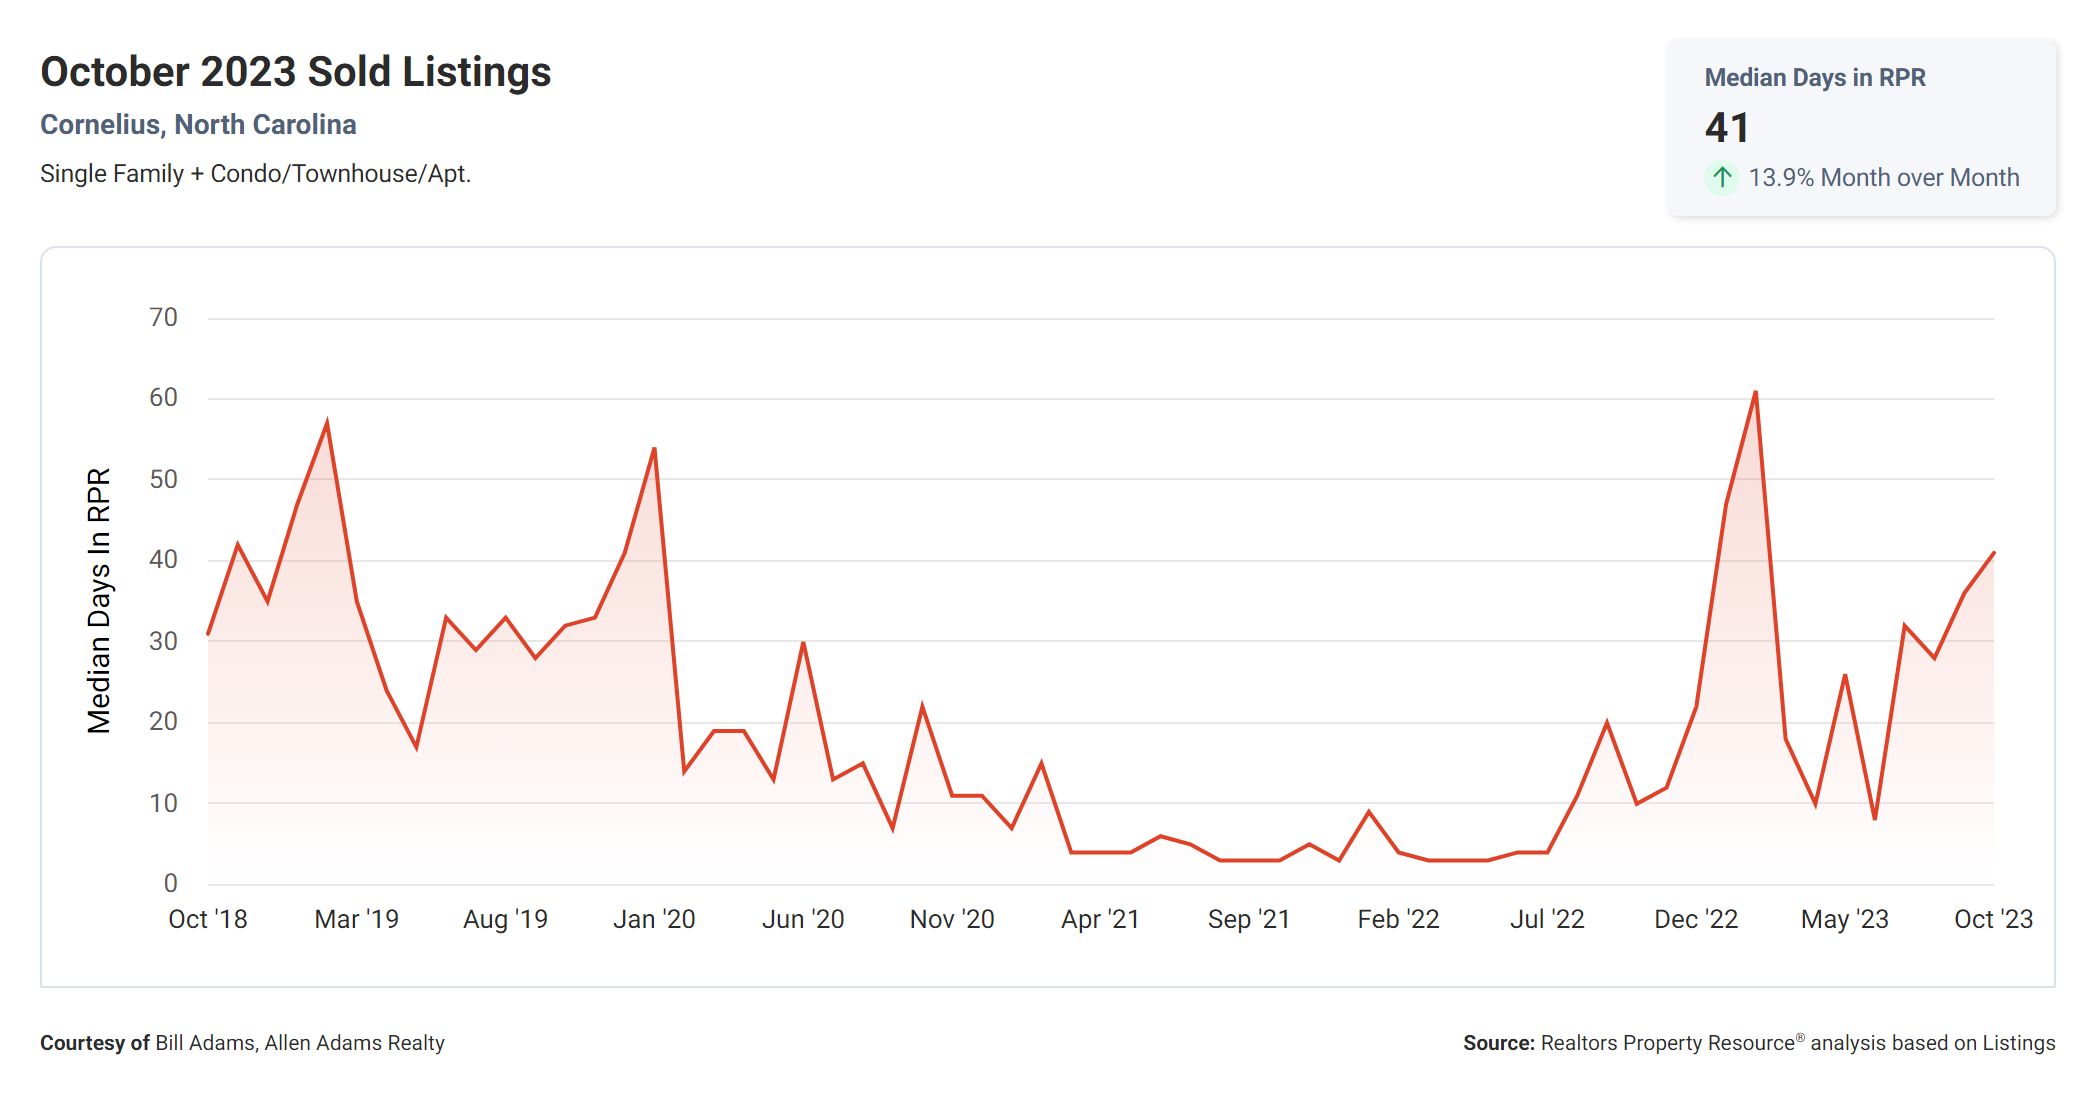
Another important metric is the “Median Days Homes are On the Market,” which currently stands at 41. This metric measures the average number of days it takes for a home to sell after being listed. A lower number suggests a faster-paced market, indicating high demand and potentially multiple offers on properties.
Sale Price Versus List Price
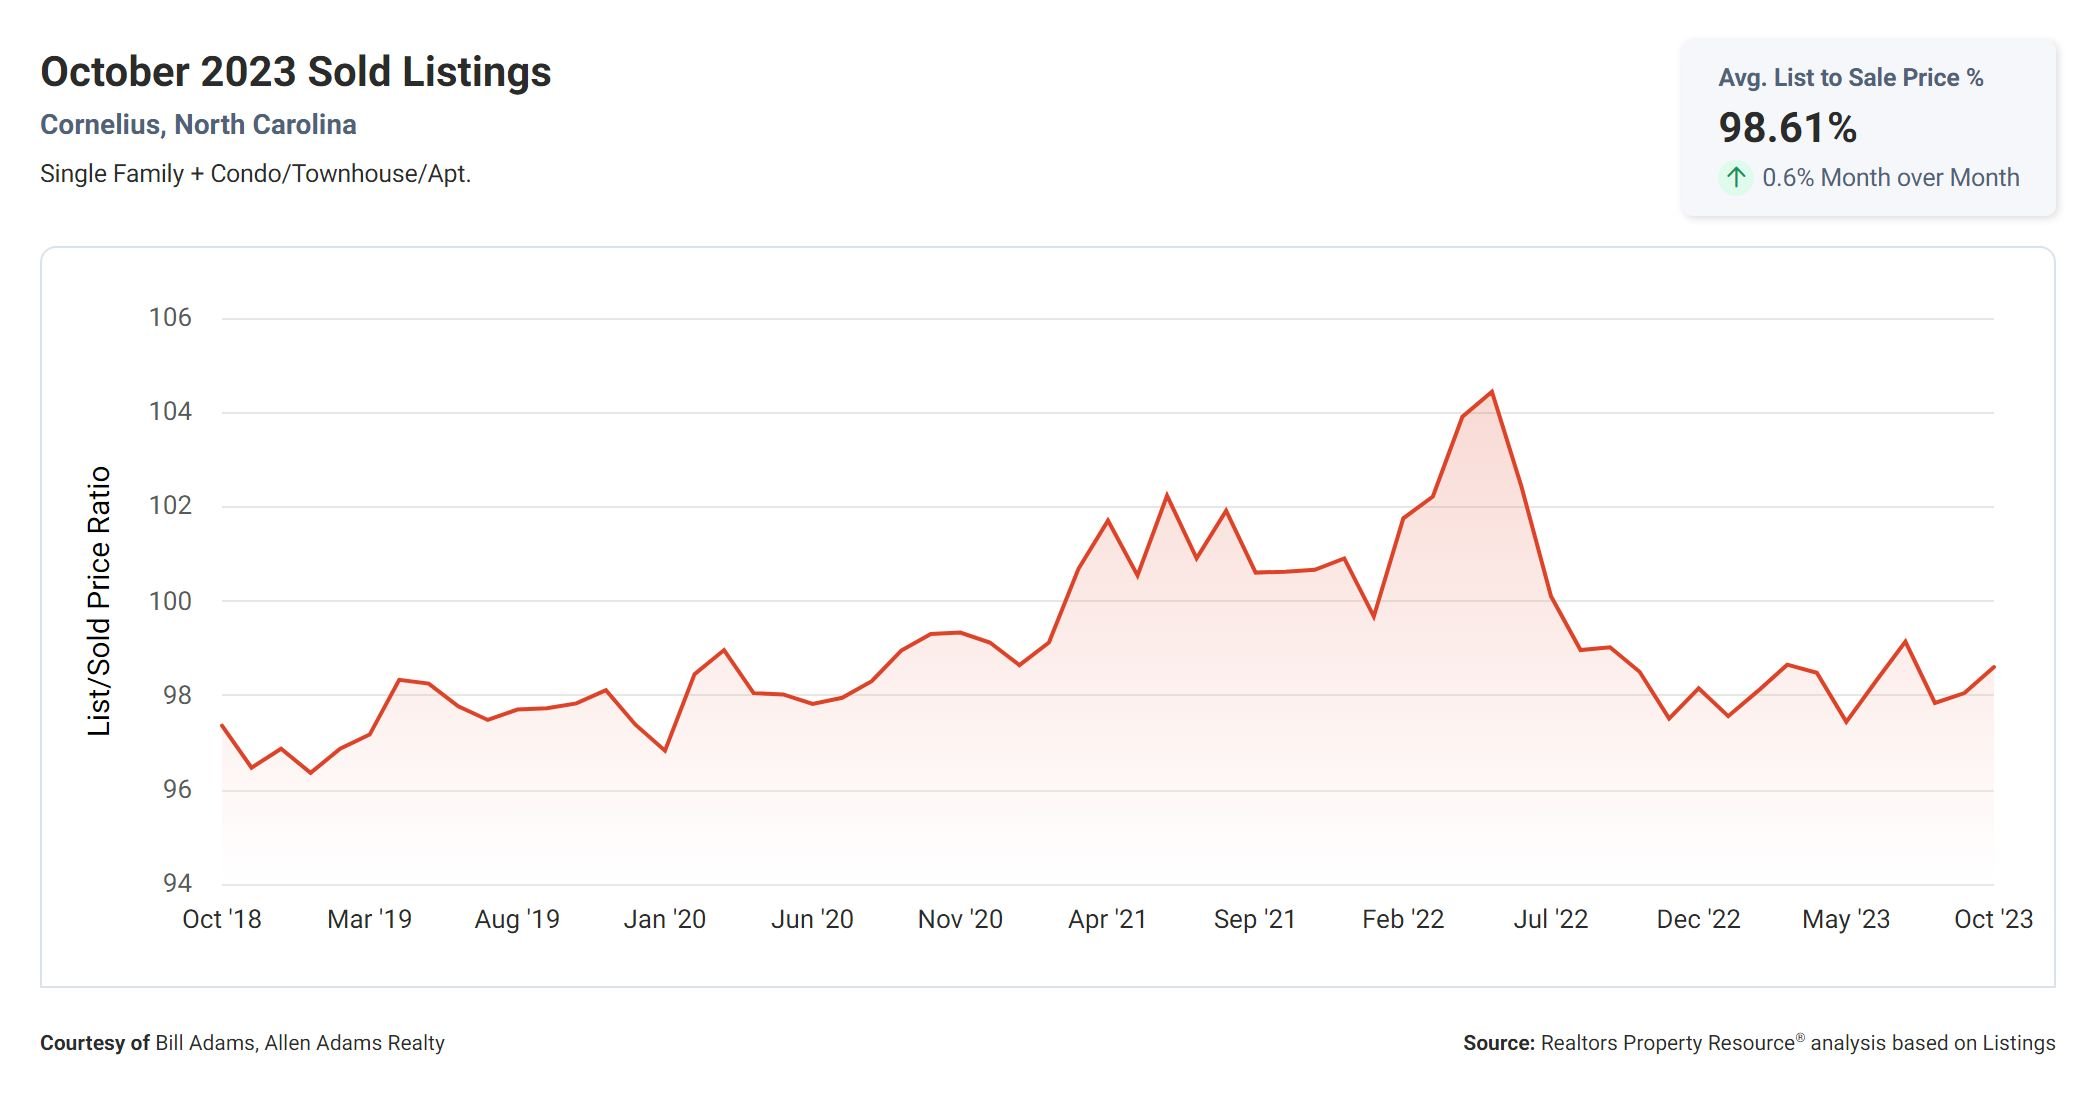
The “List to Sold Price Percentage” is another crucial metric, currently at 98.6%. This metric represents the percentage of the original listing price that sellers receive when they sell their homes. A higher percentage indicates that sellers are getting close to their asking price, suggesting a strong market where buyers may need to be competitive in their offers.
Median Sold Price
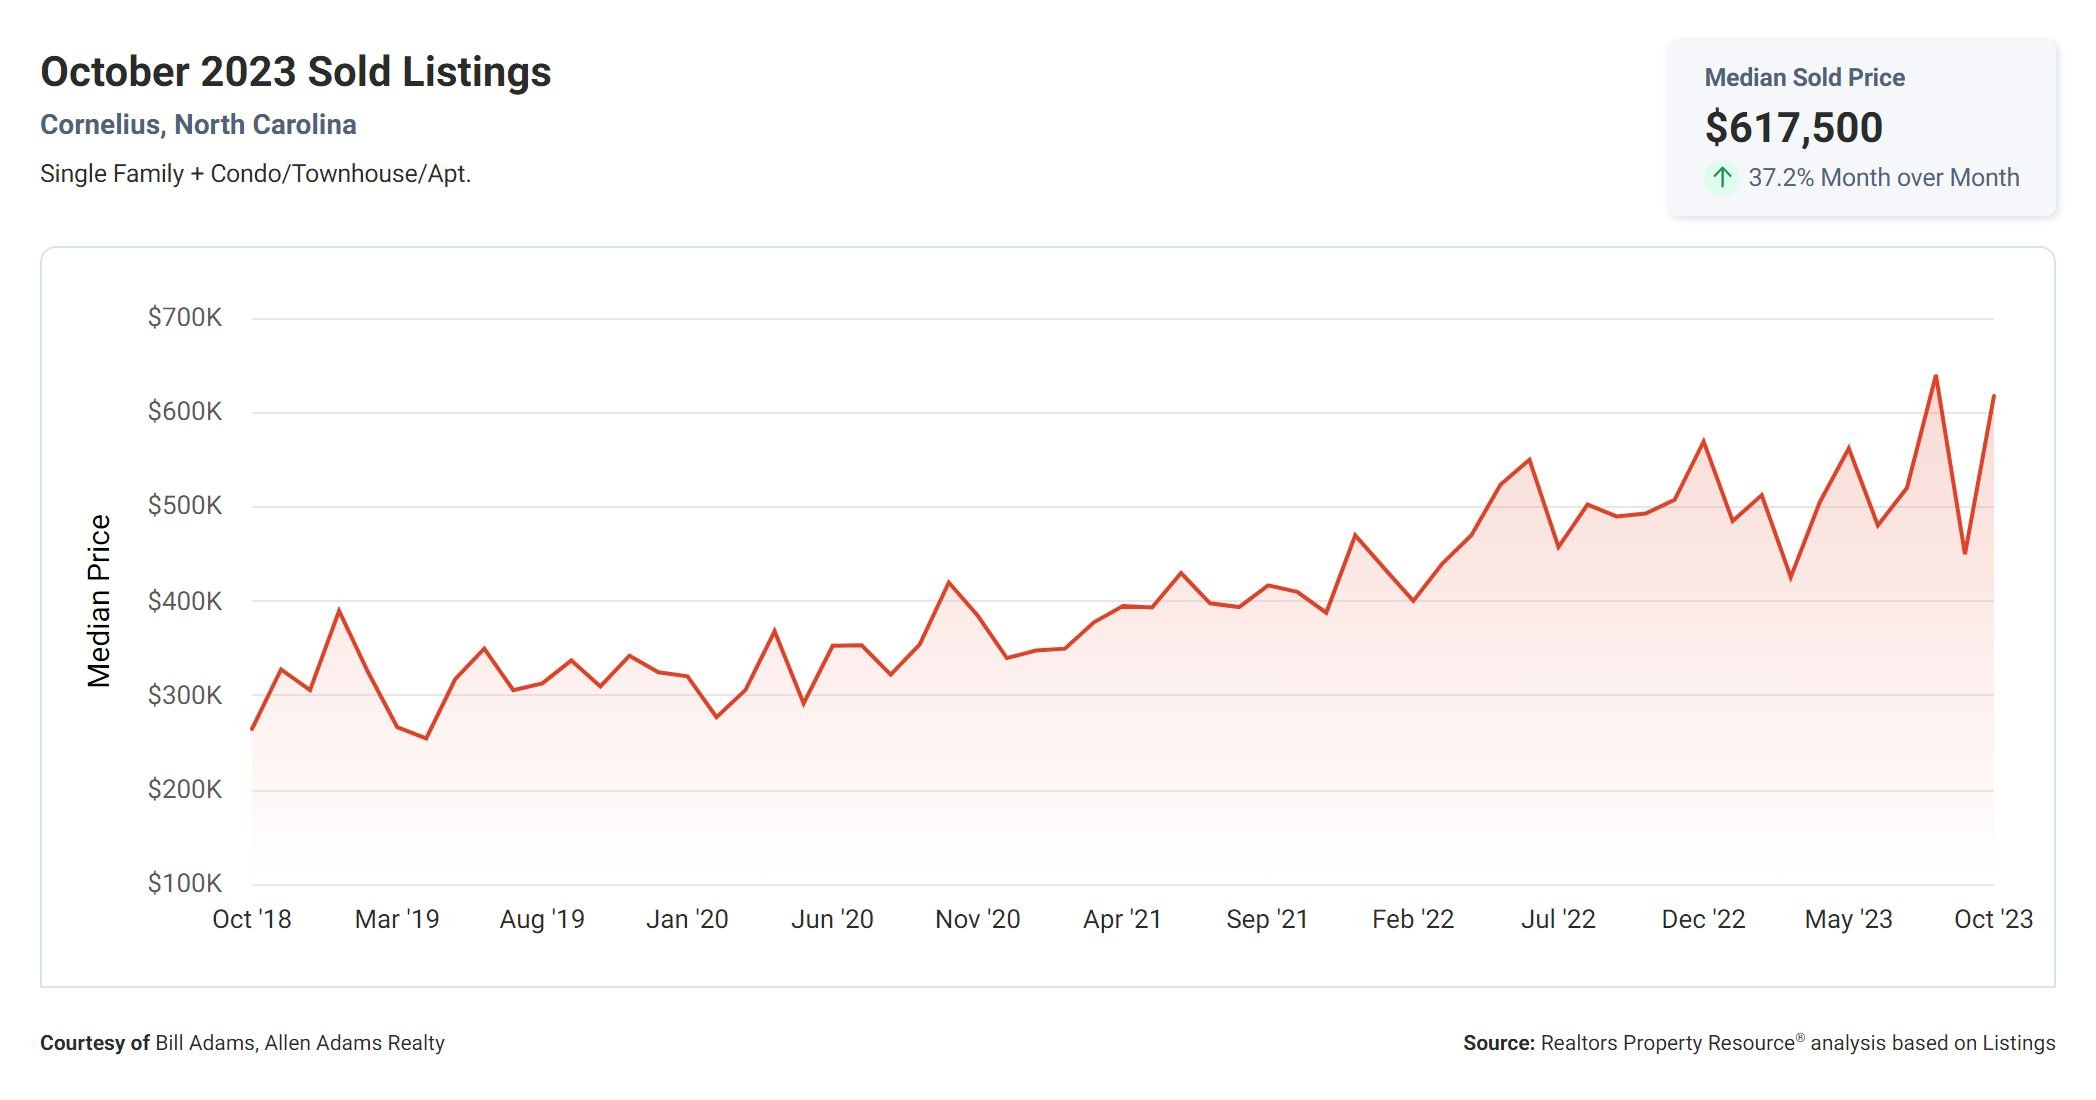
Finally, we have the “Median Sold Price,” which currently sits at $617,500. This metric represents the middle point of all the sold prices in a given area. It gives an indication of the overall price range in the market. When combined with other metrics, such as the supply of inventory and days on the market, it can help buyers and sellers gauge the pricing trends and competitiveness of the market.
What The Numbers Mean
Taking all these metrics into consideration, we can see a correlation between the increase in the number of available homes (12-Month Change in Months of Inventory) and the median days homes are on the market. As the supply of inventory increases, it may take longer for homes to sell, potentially giving buyers more time to make decisions.
Additionally, the list to sold price percentage and median sold price can provide insights into the negotiation power of sellers. A higher list to sold price percentage and a higher median sold price could suggest a seller’s market, where sellers have more control and buyers may need to be prepared to make competitive offers.
Conclusion
Overall, these metrics paint a picture of the current Cornelius, NC real estate market, providing valuable information for both buyers and sellers. It’s important to keep in mind that real estate markets can vary greatly by location, so it’s always a good idea to consult with a local real estate professional to get a better understanding of the specific market dynamics in your area.
If you would like to see Cornelius listings of homes for sale or learn more about the area click here.

