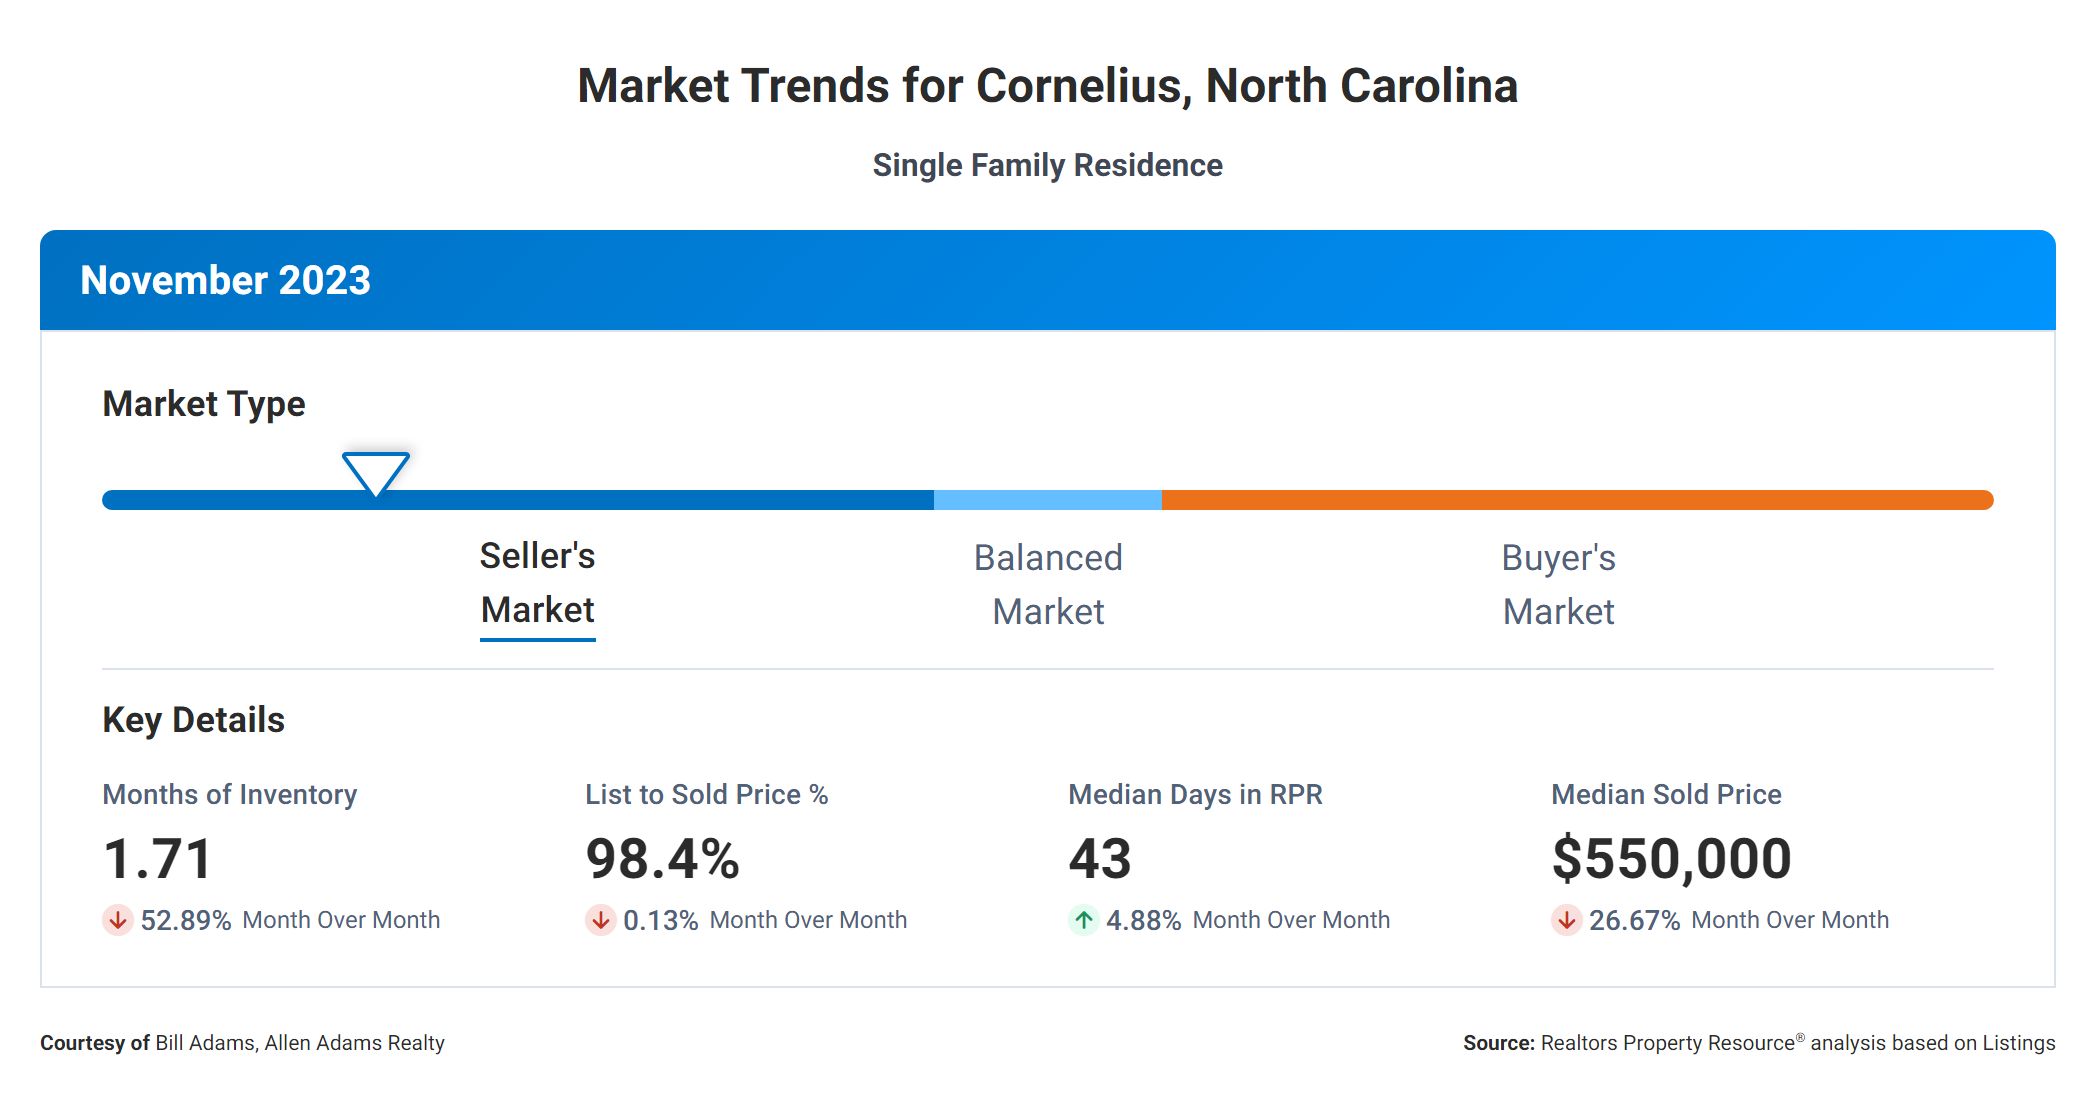
In the world of real estate, there are several key metrics that buyers and sellers should pay attention to when considering a property transaction. These metrics provide valuable insights into the current state of the Cornelius, NC market and can help guide decisions regarding pricing, timing, and negotiations. Let’s take a closer look at the correlation between some of these important real estate metrics.
Months Supply
Firstly, let’s examine the Months Supply of Inventory, which currently stands at 1.71. This metric represents the number of months it would take to sell all the available homes on the market at the current sales pace. A lower supply of inventory generally indicates a seller’s market, where demand outstrips supply, leading to potentially higher prices and faster sales.
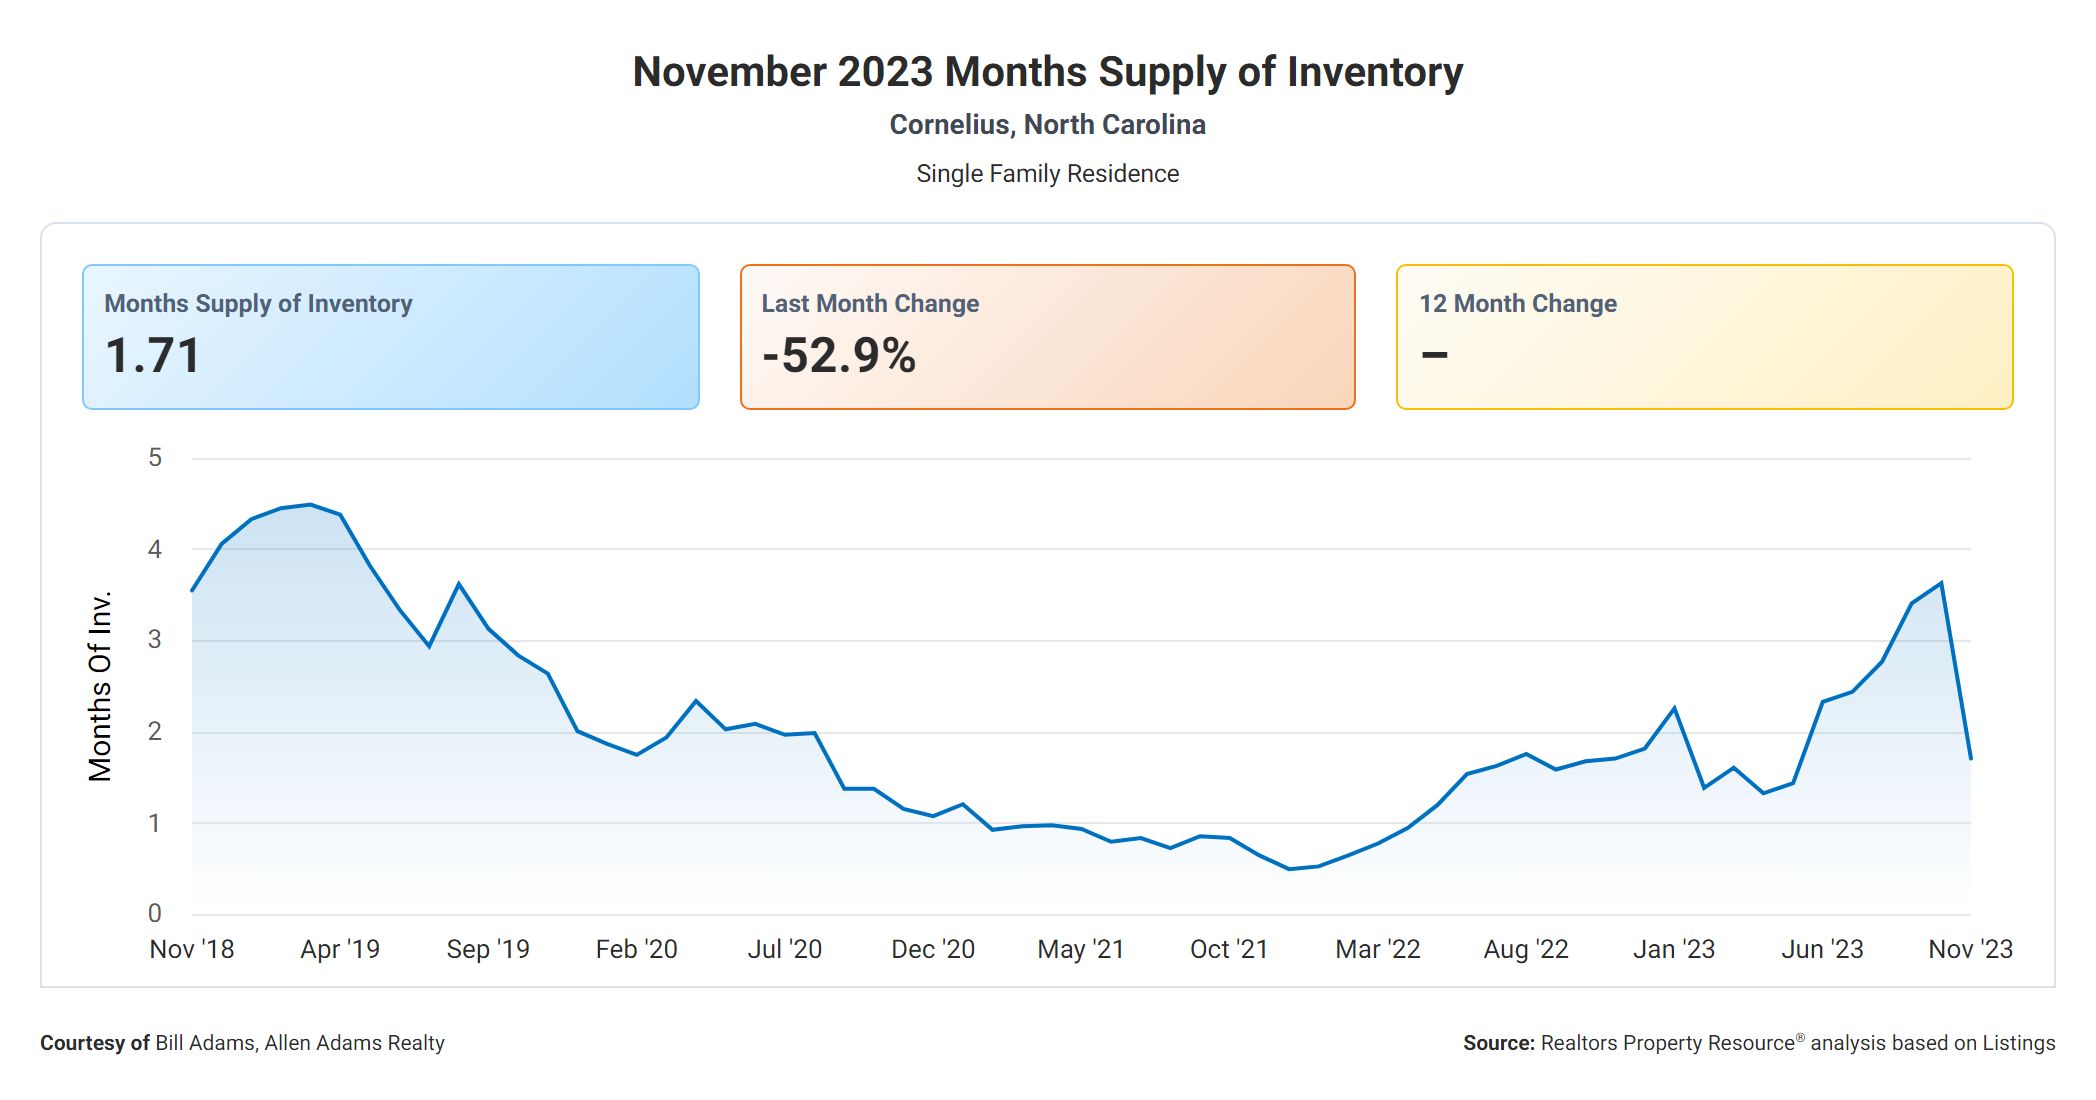
Next, we have the 12-Month Change in Months of Inventory, which shows that there has been no change in the supply of homes over the past year. This suggests a stable real estate market, with neither an increase nor a decrease in available inventory. This information can be useful for both buyers and sellers, as it indicates a consistent level of market activity.
Days On Market
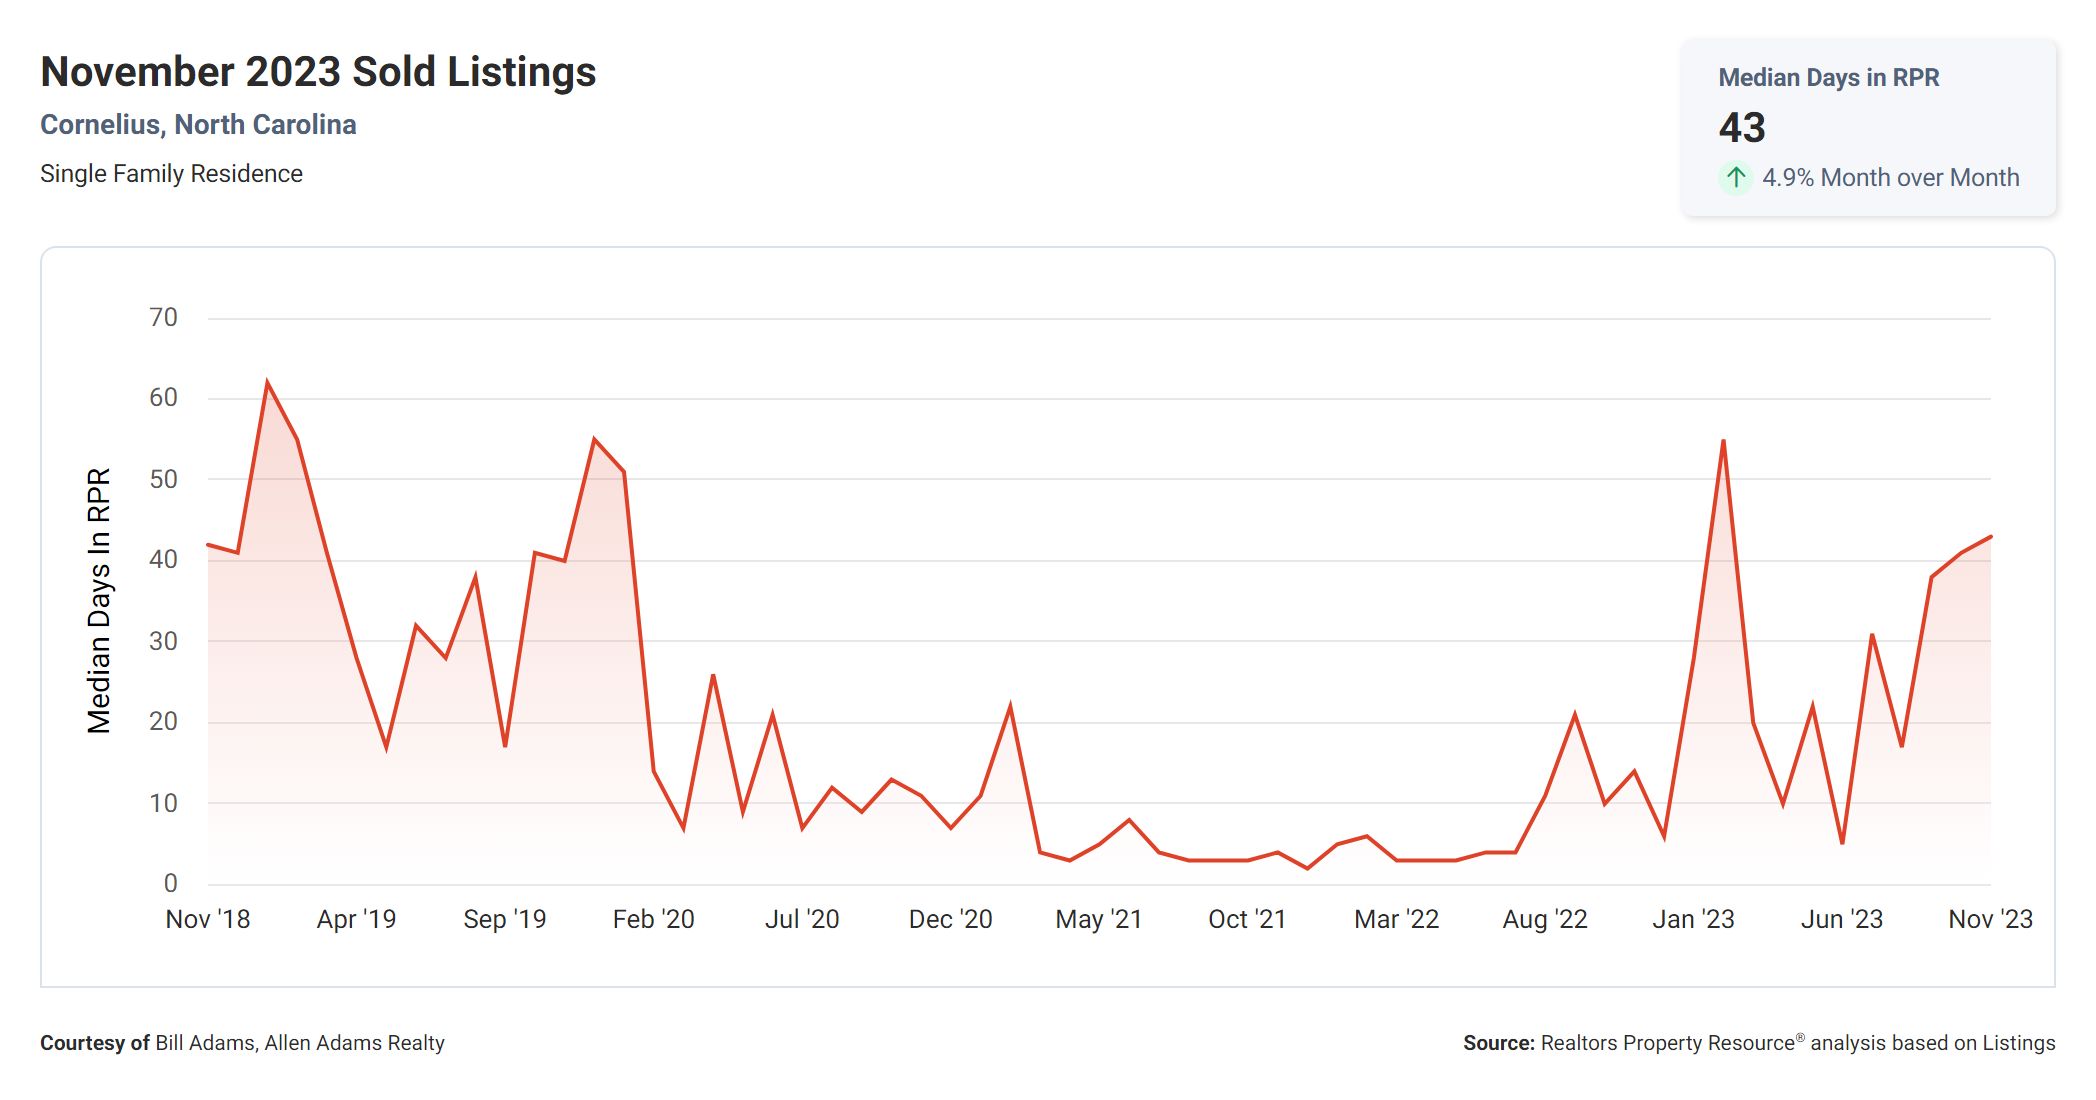
Moving on to the Median Days Homes are On the Market, we see that it takes an average of 43 days for a property to sell. This metric provides an insight into the pace of the market and how quickly homes are being bought. A shorter median time on the market suggests a more active market with higher demand, potentially leading to quicker sales.
Sale Price Versus List Price
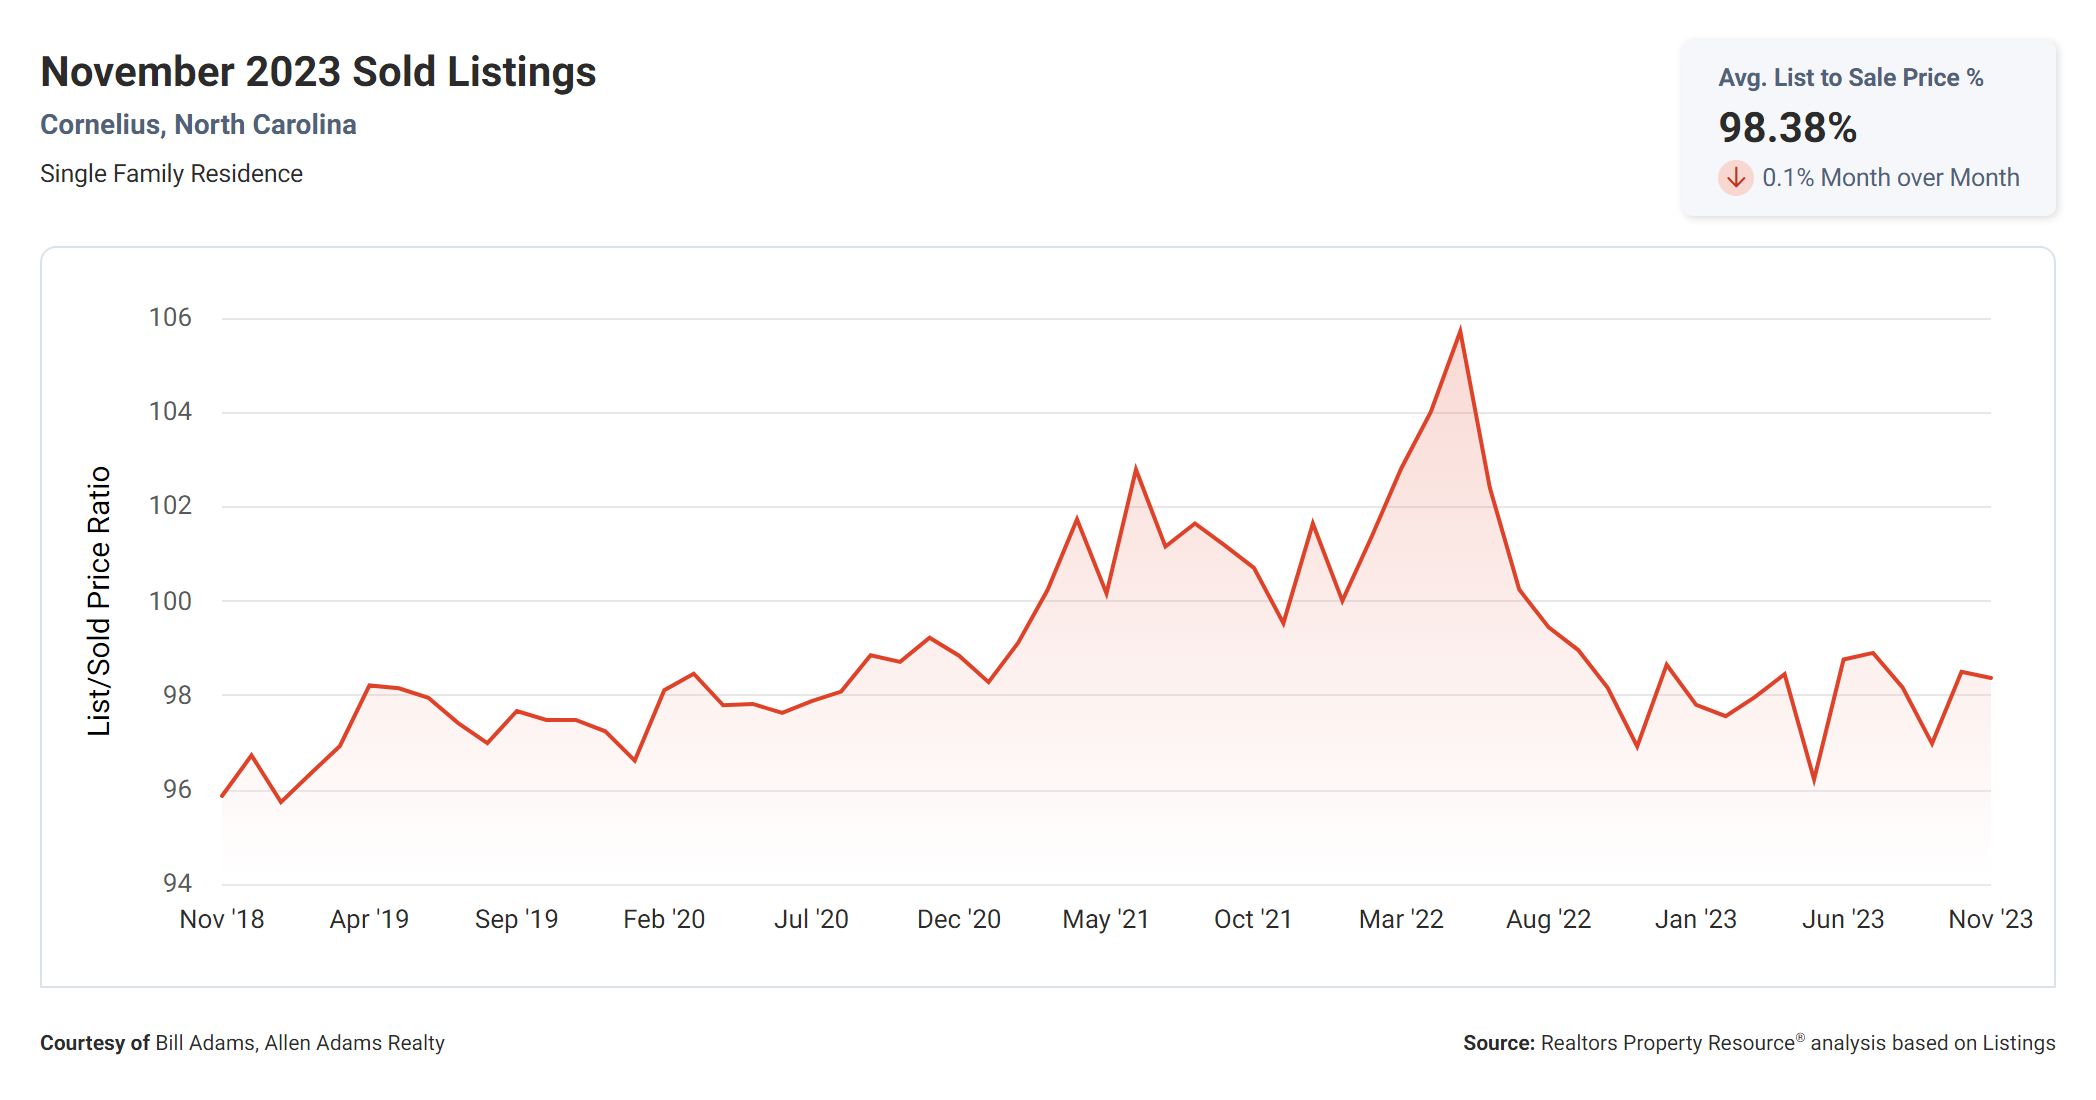
The List to Sold Price Percentage is another crucial metric that buyers and sellers should consider. With a percentage of 98.4%, this indicates that on average, homes are selling very close to their list price. This can be positive news for sellers, as it suggests that they have priced their homes accurately and are receiving offers close to their desired amount. For buyers, it highlights the importance of making competitive offers to secure a property in this market.
Median Sold Price
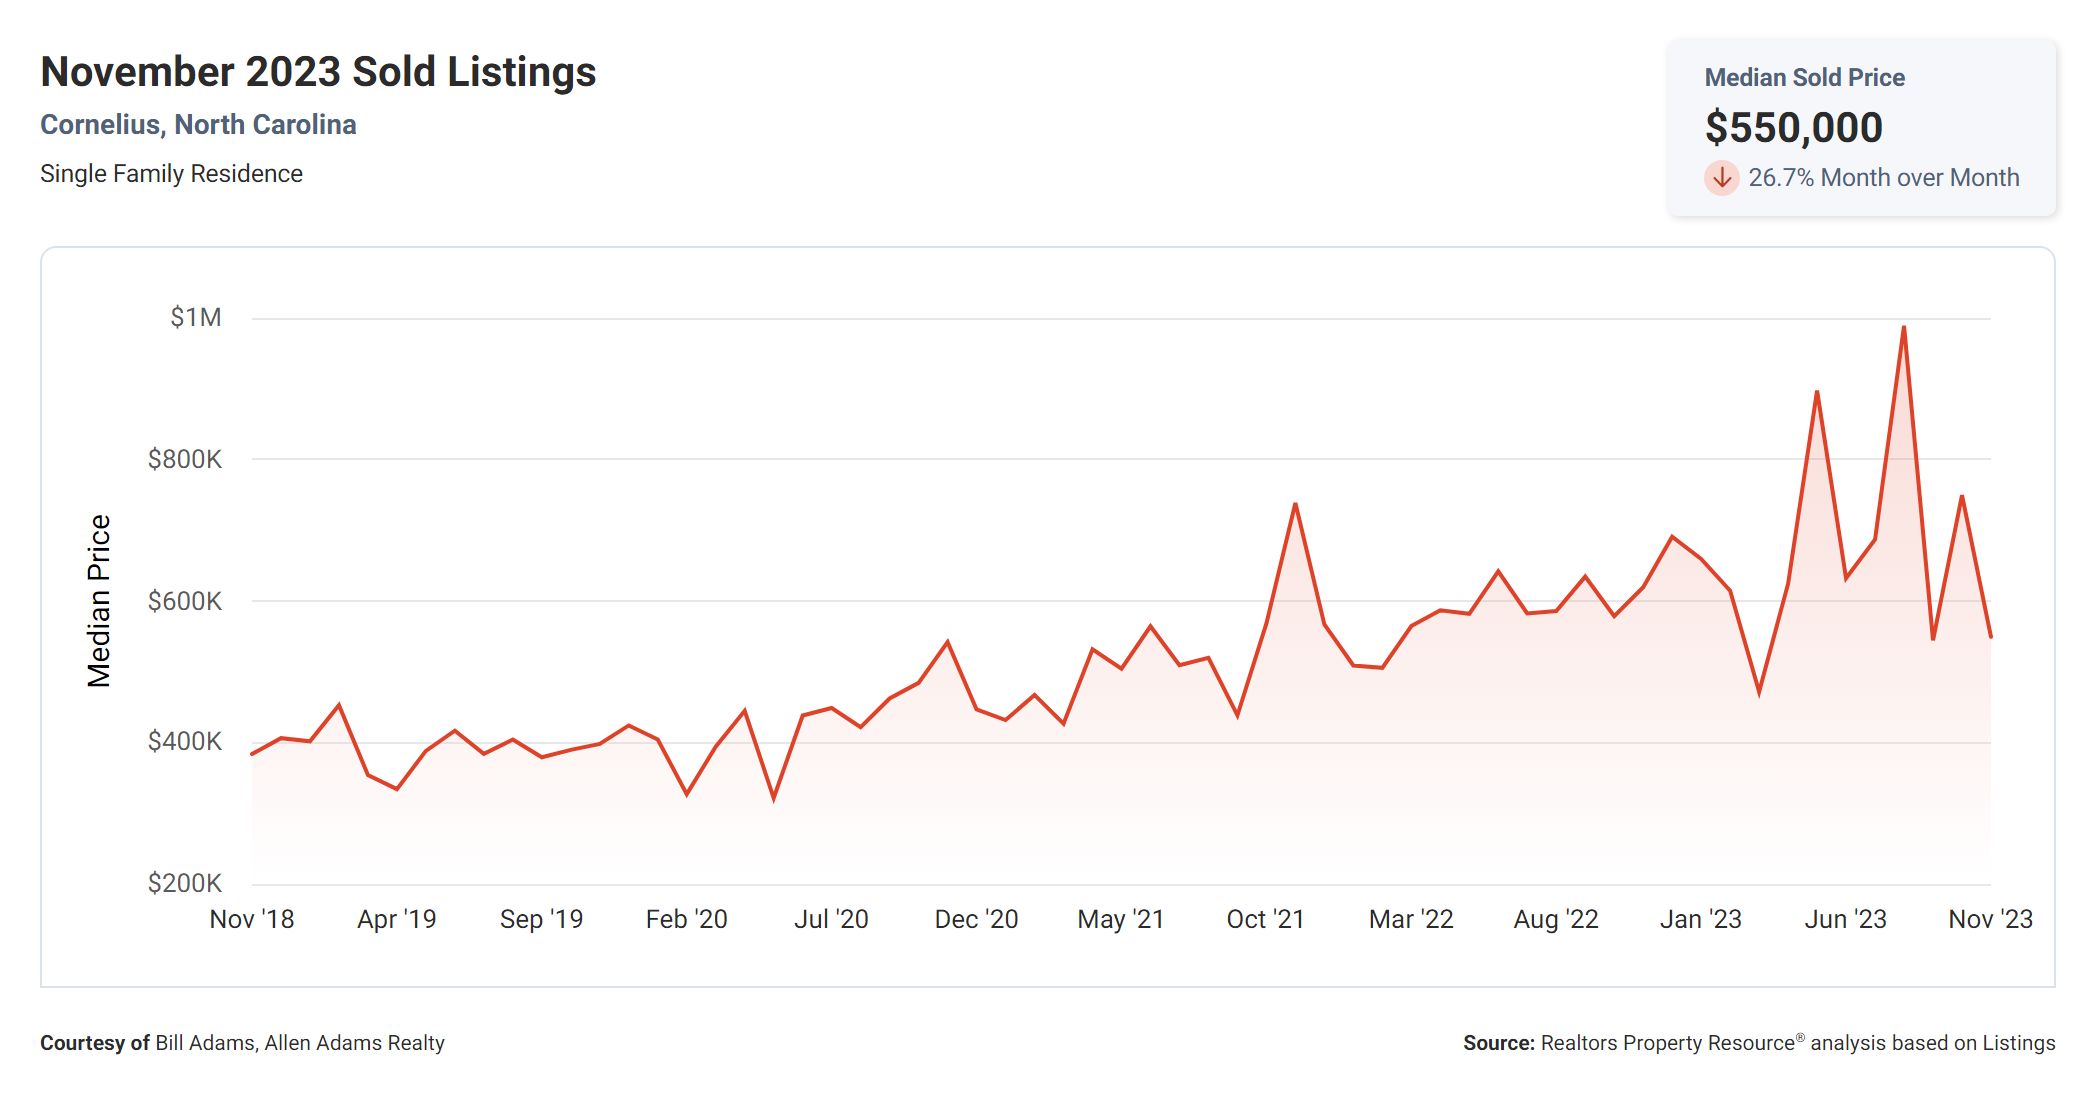
Lastly, we have the Median Sold Price, which currently stands at $550,000. This metric represents the midpoint of all the sold prices in a given market. It provides a snapshot of the overall price range and can be useful for both buyers and sellers in determining fair market value. Buyers can use this information to gauge affordability, while sellers can use it to set a competitive and realistic listing price.
What The Numbers Mean
In summary, these real estate metrics provide valuable insights into the current state of the Cornelius market. The Months Supply of Inventory, 12-Month Change in Months of Inventory, Median Days Homes are On the Market, List to Sold Price Percentage, and Median Sold Price all work together to paint a picture of the market’s health and activity. Buyers and sellers can use this data to make informed decisions, whether it be regarding pricing, timing, or negotiation strategies.
Conclusion
In essence, these metrics offer insights into the present real estate landscape, supplying valuable data for individuals looking to buy or sell property. It’s crucial to bear in mind that real estate conditions differ significantly based on location, making it advisable to seek guidance from a local real estate expert for a more comprehensive understanding of the unique market dynamics in your vicinity.
Ready To Make Cornelius, NC Your Home?
Cornelius, NC Homes For Sale

